

Proteomics Services
Omycx
Decoding health, disease and therapeutic response through proteomics.
Omycx compares healthy and disease biology in human-relevant models, generates proteomic signatures, and evaluates how therapeutics modify them so you can predict translatability before the clinic.
The Translational Gap
Human biology is diverse.
Most preclinical models are not.
Many preclinical models fail to capture the biological diversity and disease heterogeneity of real human systems, a major reason candidates that look promising early go on to fail in translation.
Omycx closes that gap. It uses high-dimensional proteomics to define therapeutic profiles in human-relevant disease models, benchmarks novel therapeutics (compounds and biologics) against clinical gold standards, and gives drug developers a clearer read on how a candidate will behave in people, thus supporting drug discovery, safety assessment and biomarker strategy.
How Omycx works
From biological diversity to therapeutic insight in four steps.

1.
Biological diversity
Every donor has a unique biological profile, reflecting the natural diversity of human biology.

2.
Comparative biology
Healthy and disease biology are compared to reveal the molecular changes that define disease and therapeutic response.
3.
Proteomic signatures
Disease focused proteomic panels are used to create distinctive signatures that define biological state.

4.
Therapeutic profiling
Signatures reveal how therapeutics modify biology and compare against clinical reference profiles.
Human Disease Models: 5 Core Areas
Omycx® compares the immune response to a therapeutic in healthy and disease state cells across therapeutically relevant disease areas. Using healthy and disease biospecimens captures human heterogeneity enabling more representative evaluation of therapeutic performance.
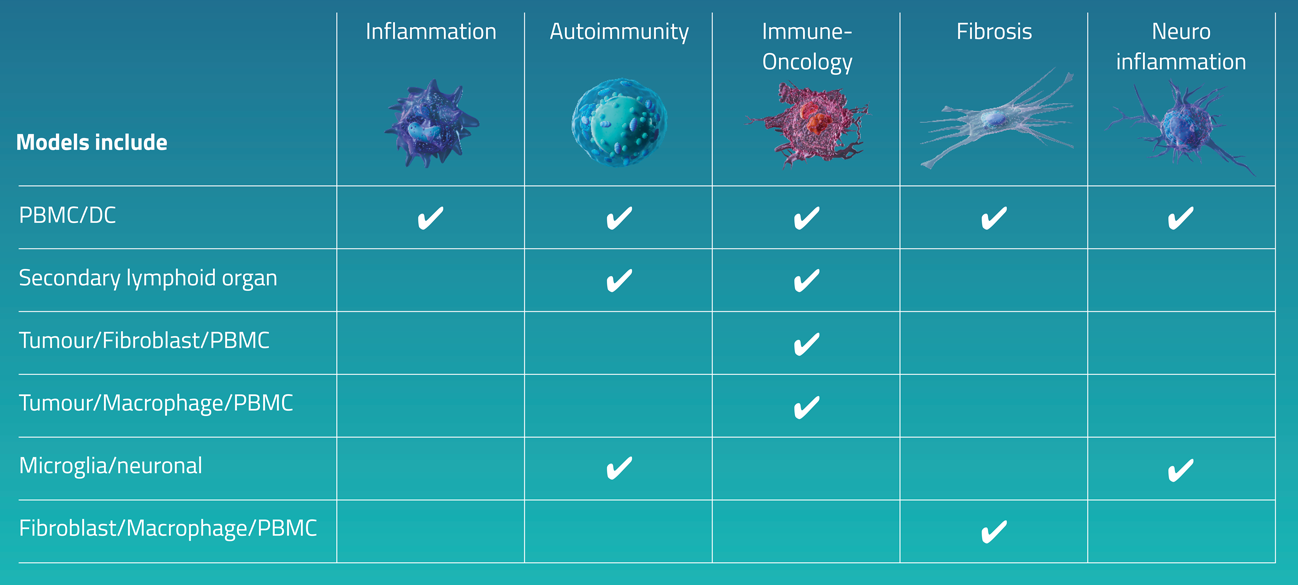
Cells and their secretome are profiled under therapeutic treated and untreated conditions to generate comparative proteomic signatures, with drug responses benchmarked against clinical reference therapeutics to support translational decision making.

The Platform
Built on Olink proximity extension assay technology
Multiplexed, high-sensitivity protein quantification from just 1 µL of sample, across a broad dynamic range. Reported as Normalised Protein eXpression (NPX) on a log₂ scale. Disease focused panels of 45 or 92 analytes.
Five core primary cell disease areas:
- Inflammation
- Autoimmunity
- Oncology
- Fibrosis
- Neuroinflammation
immune analytes per panel
core human disease models
sample volume required
PEA quantification platform
See Omyx in Action
A real Omycx data package
Proteomic profiling of five immuno-modulating small molecules in a two-way Mixed Lymphocyte Reaction (MLR), on the Olink Target 48 Cytokine panel. Use this approach to assess immuno-modulation of T cells and antigen presenting cells. This is the depth of evidence you receive, explore it below.
Experiment: 2-Way MLR Platform: Olink PEA
Readout: NPX (log₂)
Sample: cell culture supernatant, 1 µL
& RATIONALE
The two-way mixed lymphocyte reaction (MLR) induces allogeneic immune activation through direct cell-cell interactions, antigen presentation, and endogenous cytokine signalling, resulting in a polyclonal T cell response that simultaneously engages multiple immune pathways. The resulting proteomic profile reflects a broad activation state while preserving inter-donor variability.
Proximity Extension Assay (PEA) technology enables multiplexed protein quantification from 1 µL of sample with high sensitivity across a broad dynamic range. The Olink Target 48 Cytokine panel measures 45 immune mediators; interleukins, chemokines, interferons, and growth factors.
Profiling across a concentration series enabled characterisation of both the primary treatment effect and any concentration-dependent regulation at the protein level. Data are reported in Normalised Protein eXpression (NPX) units on a log2 scale; fold changes are calculated relative to the matched vehicle control for each compound.
Readout
NPX (log₂)
Experiment type
2-Way MLR
Platform
Olink PEA
Analytes
45
Sample / Volume
Cell culture supernatant · 1 µL/sample
Panel
Target 48 Cytokine
This report focuses on the small-molecule arm of the experiment, including kinase inhibitors and broad-spectrum immunosuppressants. Each compound is paired with a matched vehicle control.
| Compound | Target / MoA | Class | Indication |
|---|---|---|---|
| Cyclosporin A | Calcineurin inhibitor | Broad | Rheumatoid arthritisatopic dermatitispsoriasis |
| Methotrexate | DHFR inhibitor | Suppress | Leukaemia/lymphomapsoriasisCrohn's disease |
| Prednisolone | Glucocorticoid receptor agonist | Broad | Severe inflammationasthmaarthritis |
| Rapamycin | Serine/threonine protein kinase inhibitor | Inhibitor | Prevention of transplant rejection |
| Tofacitinib | JAK1/3 inhibitor | Inhibitor | Rheumatoid arthritisulcerative colitisankylosing spondylitis |
Class labels: Suppress = targeted immunosuppression; Broad = broad-spectrum immunosuppression; Inhibitor = targeted pathway inhibition.
ANALYTES
The Olink Target 48 Cytokine panel measures 45 proteins across four functional groups: cytokines, chemokines, growth factors and tissue-repair mediators, and tissue-remodelling and stress-response markers. Panel composition is shown in the table below.
| Functional group | Analytes |
|---|---|
| Cytokines | FLT3LGCSF3CSF2IFNGIL1BIL2IL4IL6IL7IL10IL13IL15IL17AIL17CIL17FIL18IL27IL33LTACSF1OSMTNFTNFSF10TSLPTNFSF12 |
| Chemokines | CCL2CCL3CCL4CCL7CCL8CCL11CCL13CCL19CXCL8CXCL9CXCL10CXCL11CXCL12 |
| Growth Factors & Tissue Repair | HGFEGFTGFAVEGFA |
| Tissue Remodelling & Stress Response | MMP1MMP12OLR1 |
REDUCTION
Each point represents one sample projected into two dimensions from the full 45-protein cytokine profile. The treatment-coloured panel shows whether samples cluster by small-molecule compound; the donor-coloured panel shows the degree of inter-donor variation.
Axes: dimensionality reduction coordinates. Panels show the small-molecule subset only; matched vehicle controls are shown with their associated compounds.
& DOSE RESPONSE
Model: NPX ~ TreatmentGroup + log₁₀(conc) + (1|Donor). The treatment coefficient tests whether the drug differs from its matched control across the assayed concentration range, accounting for inter-donor variation. X = modelled NPX difference vs control; Y = -log₁₀(BH FDR-adjusted p). Significance requires adj. p < 0.05 and |ΔNPX| ≥ 0.5. Click a protein to load per-donor dose-response curves.
COMPARISON
The clustered heatmap compares small-molecule signatures across the full protein panel. Switch between raw ΔNPX (NPX difference vs. matched control) and row z-score (each protein mean-centred across small molecules).
ΔNPX vs. matched control. Colour scale clipped at the 95th percentile of absolute values. Rows and columns are hierarchically clustered.
ENRICHMENT
The network below maps the measured proteins onto their associated biological pathways. Each protein node is positioned in the inner ring; pathway nodes occupy the outer ring. Edge thickness shows the number of pathways shared between connected proteins - thicker edges indicate more co-enriched processes. Node colour shows direction of regulation relative to control (teal: upregulated, navy: downregulated, grey: below threshold).
Results across the small-molecule compounds are summarised below using the primary mixed-effects model.
Loading summary...
Cyclosporin A showed a consistent downward trend in CCL2, CCL7, CCL8, CXCL10, and IL-17A across all three donor-pair combinations, though the mixed-effects model did not reach significance overall.
Methotrexate primarily suppressed the IL-17 inflammatory axis, including IL-17A/F, IL-13, CXCL10, OSM, and IFN-γ. This is consistent with published evidence that methotrexate can reduce IL-17 expression at the transcript level1.
Rapamycin showed a chemokine-centred profile, with reduced CCL2, CCL7, and CCL8. This aligns with the known effects of mTOR inhibition on monocyte chemokine secretion through NF-κB/MAPK signalling2.
Tofacitinib reduced IFN-γ and IL-17, consistent with published human CD4+ T-cell evidence that JAK inhibition with tofacitinib/CP-690,550 suppresses IFN-γ and IL-17 production3,4.
Prednisolone reduced IL-13, IL-17A/F, HGF, and OSM, while increasing IL-10, CCL11, CCL13, CSF3, and IL-27.
- Li Y, Jiang L, Zhang S, Yin L, Ma L, He D, Shen J. Methotrexate attenuates the Th17/IL-17 levels in peripheral blood mononuclear cells from healthy individuals and RA patients. Rheumatology International. 2012;32(8):2415-2422. Epub 2011 Jun 21. doi: 10.1007/s00296-011-1867-1. PMID: 21691744. (The abstract reports dose-dependent suppression of IL-17 at the mRNA level, but not at the protein level, in PBMCs.)
- Lin HY, Chang KT, Hung CC, Kuo CH, Hwang SJ, Chen HC, Hung CH, Lin SF. Effects of the mTOR inhibitor rapamycin on monocyte-secreted chemokines. BMC Immunology. 2014;15:37. Published 2014 Sep 26. doi: 10.1186/s12865-014-0037-0. PMID: 25257976.
- Ghoreschi K, Jesson MI, Li X, Lee JL, Ghosh S, Alsup JW, Warner JD, Tanaka M, et al. The JAK inhibitor tofacitinib regulates synovitis through inhibition of interferon-γ and interleukin-17 production by human CD4+ T cells. Arthritis & Rheumatism. 2012;64(6):1790-1798. doi: 10.1002/art.34329. PMID: 22147632.
- Maeshima K, Yamaoka K, Kubo S, Nakano K, Iwata S, Saito K, Ohishi M, Miyahara H, et al. Inhibitory effects of the JAK inhibitor CP690,550 on human CD4(+) T lymphocyte cytokine production. BMC Immunology. 2011;12:51. doi: 10.1186/1471-2172-12-51. PMID: 21884580.
Data packages built for decisions, not just data
Drug Profiling
Concentration-dependent biomarker responses for each therapeutic.

Benchmark analysis
How your drug works compared to clinical therapeutics or in drug combinations.

Biological Pathways
Drug mechanisms of action in health and disease. Gain insights from diseased donors proteomic signatures.
Drug differentiation
Data packages that highlight how your therapeutic differs from current treatment.
Why Nexus Bioquest
Turning proteomic data into confident decisions
Omycx pairs high-dimensional proteomics with the scientific depth of a large CRO and the speed and flexibility of a specialist team. Our scientists don't just return data, they interpret it, benchmark it, and tell you what it means for your programme. Five core primary cell disease models:
Evaluate your therapeutic in human-relevant biology
Talk to a scientist about profiling your programme with Omycx or request the full example data package.
Proteomics across the drug development pipeline
Olink-based proteomics also supports in vivo and clinical programmes and sits within Nexus BioQuest's wider immunology CRO suite.
Proteomics for in vivo studies
Extend proteomic profiling into your animal models.
Clinical & translational proteomics
Carry signatures through into clinical programmes.
The full immunology CRO suite
Flow, imaging, MSD, functional assays and more.