B cell
Autoimmunity Assays
- Antibody production (Total IgG)
- Memory B cell Antibody Isotypes
- Naïve B cells Isotype switching
- B cell proliferation/activation/cytokine secretion
- Antigen presentation
Assays
Tonsils are a secondary lymphoid tissue rich in B cell subsets and the specialized, anatomically restricted T follicular helper (Tfh) subset of CD4 T cells. Tonsils provide an accessible source of cells for those interested in B cell immunology, Tfh biology and vaccine development. The tonsillar cell re-aggregate model provides functional insight into human germinal center biology, allowing measurement of key features including naive B cell differentiation, plasma cell/plasmablast differentiation, and antibody production.
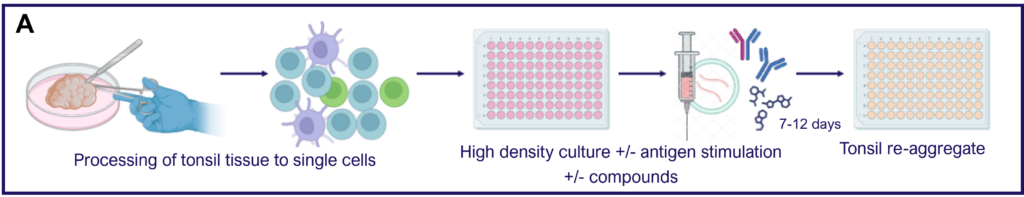
Figure A. Schematic representation of tonsil re-aggregate model. Cells are seeded at high density in 96 well plates; unstimulated (US) or stimulated with quadrivalent inactivated influenza vaccine (IIV) in the presence of vehicle or reference inhibitors such as Rapamycin. B cell readouts include B cell phenotyping, B cell proliferation and hemagglutinin (HA)-specific IgG by ELISPOT or ELISA.
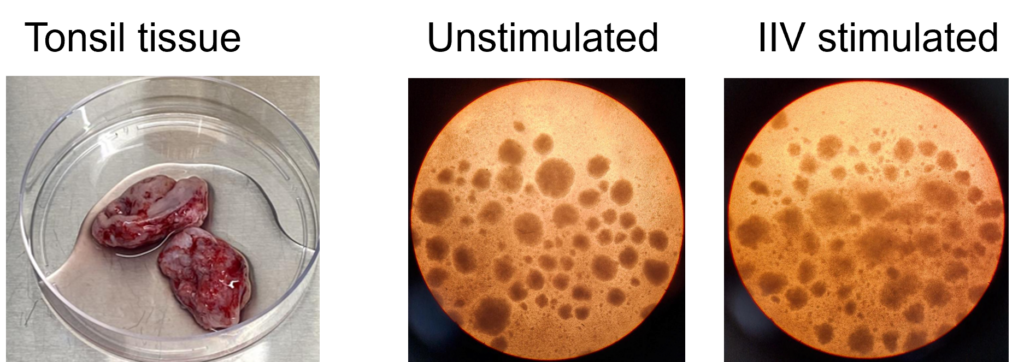
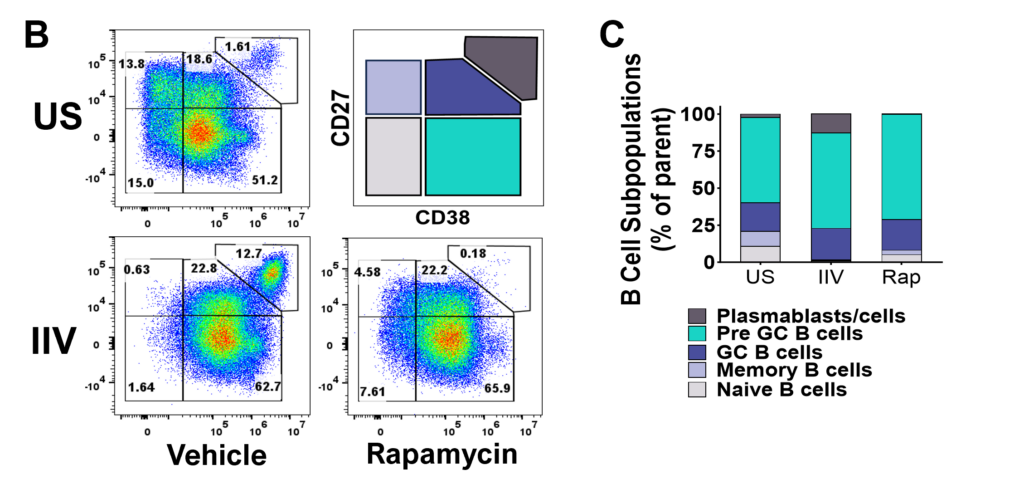
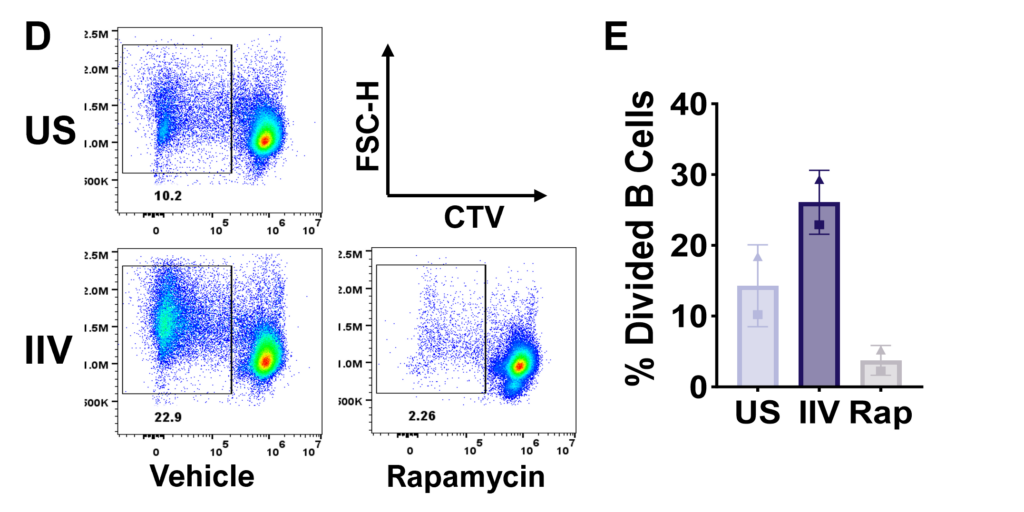
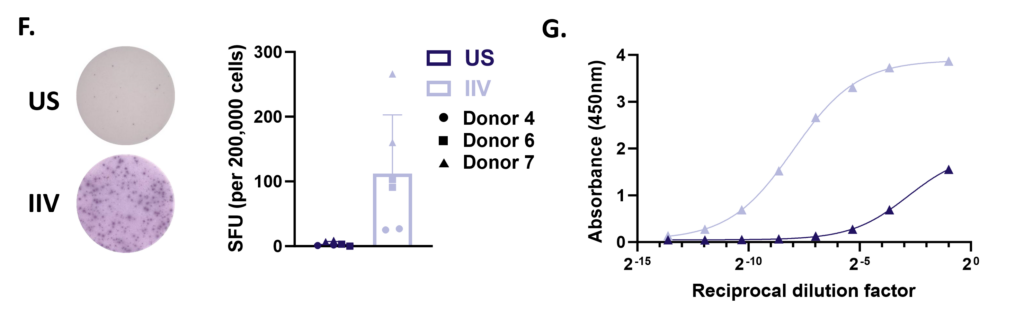
Figure F. HA-specific IgG production on day 7 measured by ELISpot. Representative images from one donor (left) and bar graph showing spot forming units (SFU) per 200,000 cells from 3 pre-selected IIV responsive donors run in duplicate wells (right). G. HA-specific IgG secretion on day 12 by ELISA. Representative dilution curves from one donor
Peripheral blood B cells can be stimulated with T-independent and T-dependent stimuli driving effector functions such as B cell activation, proliferation, Ig production and Ig class switching. Therapeutic intervention using pan or B cell suppressants - Rapamycin, Cyclosporin A or BTK inhibitor Ibrutinib respectively modify B cell function. Other B cell readouts such as downstream signaling following BcR cross linking and B cell antigen presentation to T cells can be assessed.
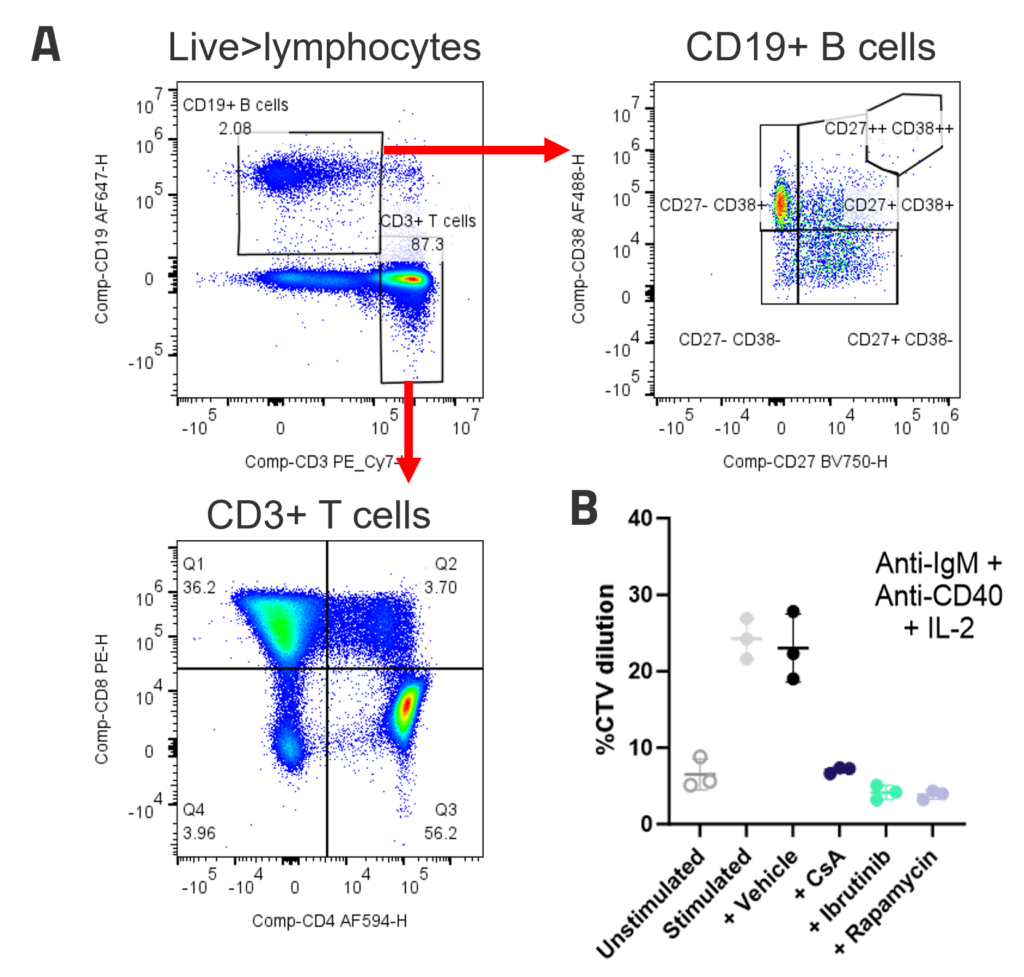
A. Peripheral blood B cells constitute around 2-5% of PBMC and contain predominantly naïve (CD27-CD38+) and memory (CD27+CD38-) populations. Example B and T cell profiles in unstimulated PBMC (B) B cell proliferation to polyclonal T dependent stimuli. PBMC were stimulated with anti-IgM + anti-CD40+ IL-2. Graphs show B cell %CTV dilution as a measure of proliferation Stimulation was performed in the presence or absence of inhibitors; FK506, Ibrutinib or Rapamycin. Bars indicate mean +/- SD, n = 3 donors.
B cell depletion is reported to not only have the potential to alter levels of auto-antibodies but also the immune milieu – B cells produce many soluble mediators which impact on other immune cell types such as T cells and DC, so depletion of B cells has the potential to regulate other subsets involved in the disease process. Alemtuzumab was used to show NK cell mediated B cell depletion further examples using Rituximab are available.
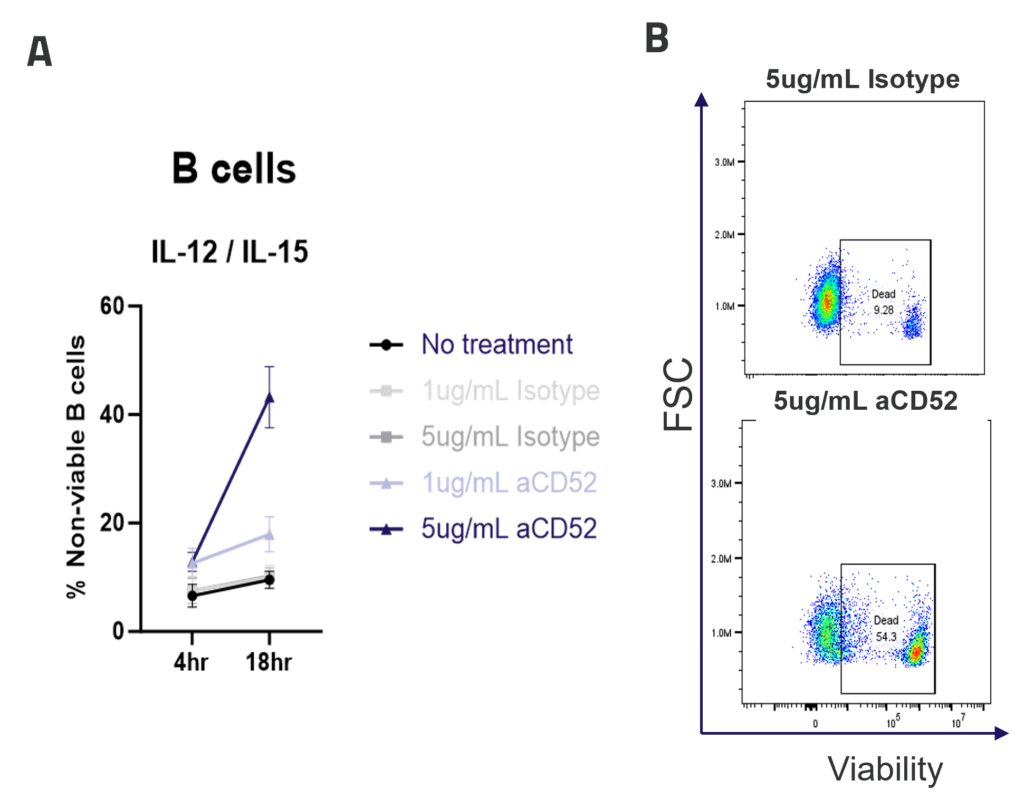
A. ADCC mediated B cell depletion. PBMCs were rested overnight with IL-12/IL-15 pre-activation, before addition of IgG1 isotype control or anti-CD52 Alemtuzumab (1ug/mL, 5ug/mL). The viability of CD4, CD8 and B cells (A) was measured by flow cytometry after 4 or 18hr of culture. Graphs show mean +/- SEM, n = 3 donors. Representative dot plots (B) show B cell viability after 18hr of culture.

Drug Discovery Tool
Find the right immune assay for your therapeutic area, modality and target using this interactive Drug Discovery Tool.