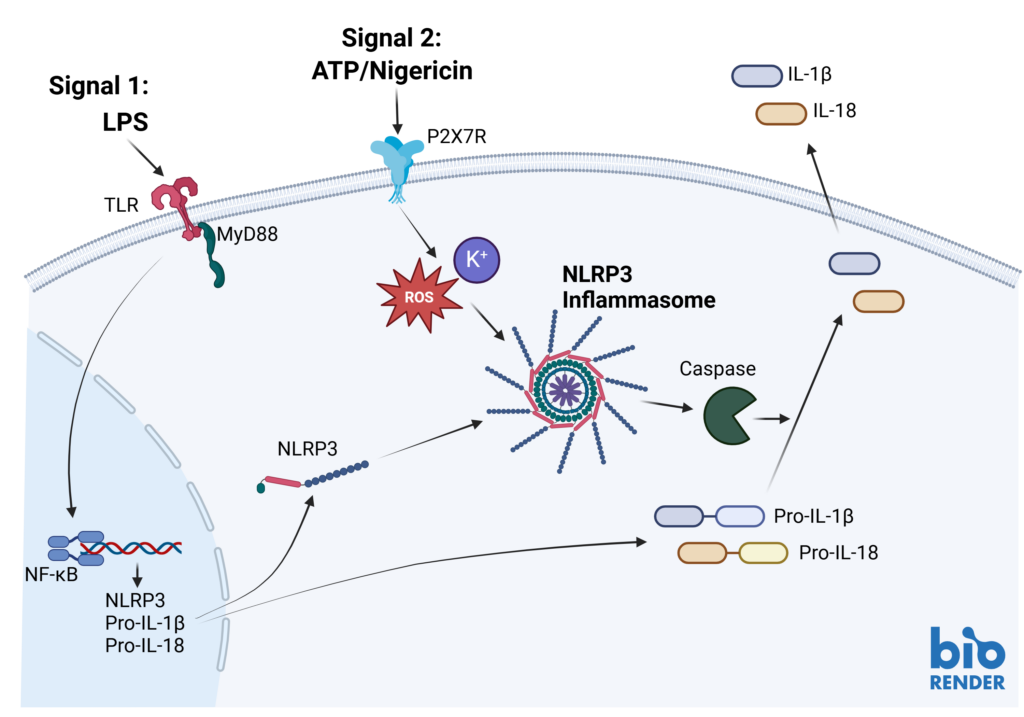
Inflammasomes are key signaling platforms within the immune system. Inflammasome complexes form in response to infection, tissue damage or metabolic imbalances. Once formed the inflammasomes activate Caspase 1 which in turn activated the pro-inflammatory cytokines IL-1β and IL-18. Targeting the inflammasome and the resulting signaling pathways is a useful tool in modulating the immune system.


Effect of MCC950 on Inflammasome activation – IL-1β and IL-18.
PBMC from three healthy donors were pretreated with MCC950, vehicle (DMSO) or media for 1 hours prior to stimulation with LPS for 4 hours. Nigericin was then added for a further 45 minutes prior to harvest of the cell culture supernatant for quantification of (A) IL-1β and (B) IL-18 by TR-FRET and ELISA respectively. Data points show mean +/- SEM of technical replicates. One-way ANOVA with Dunnett’s multiple comparisons test comparing stimulated (media) to unstimulated, LPS alone, vehicle and MCC950 to vehicle; *<0.05, **<0.01, ***<0.001.
Other formats: PBMC, macrophage subsets, microglia
Cytokine release assay can be used to “de-risk” any potential unwanted effects of novel biotherapeutics in accordance with FDA and EMA recommended guidelines.
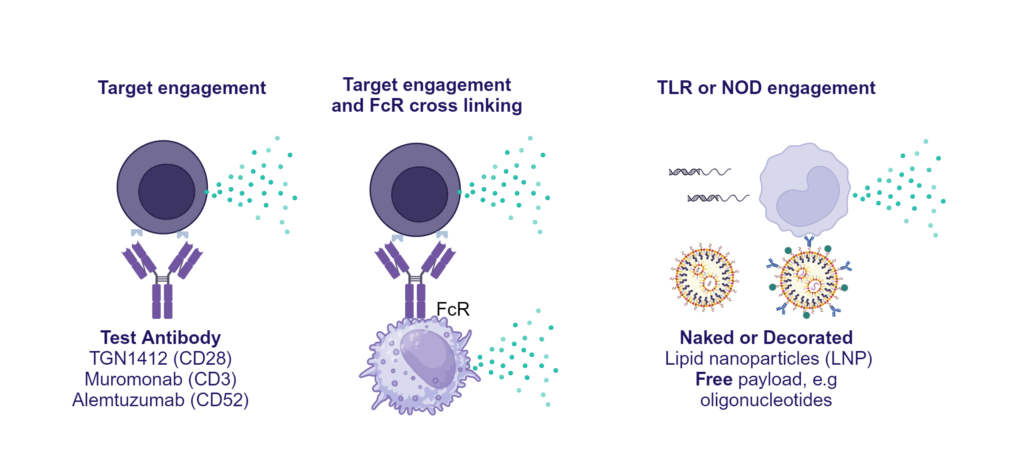
Preclinical safety cytokine release assay (CRA)
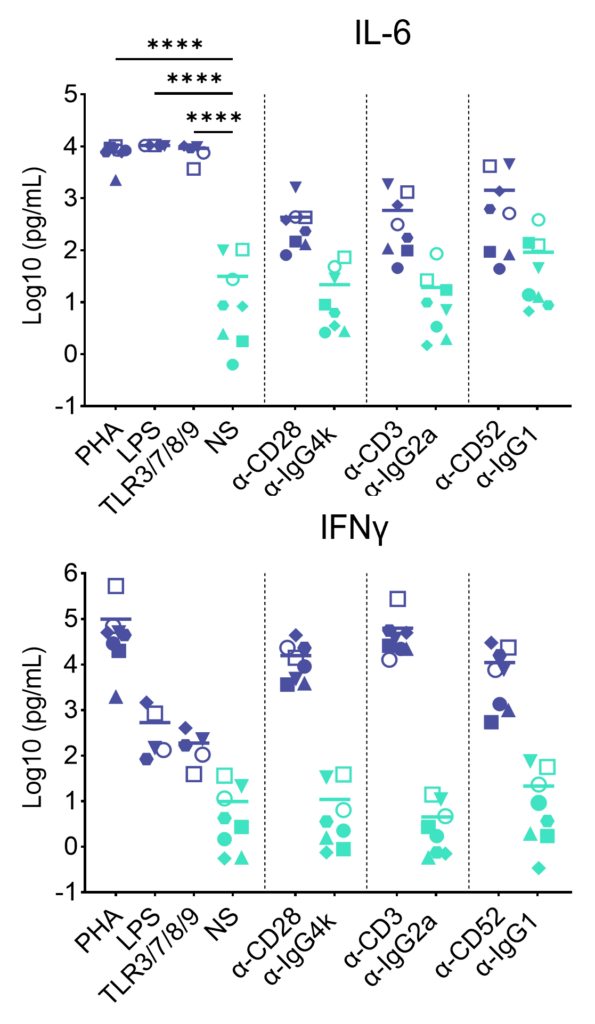
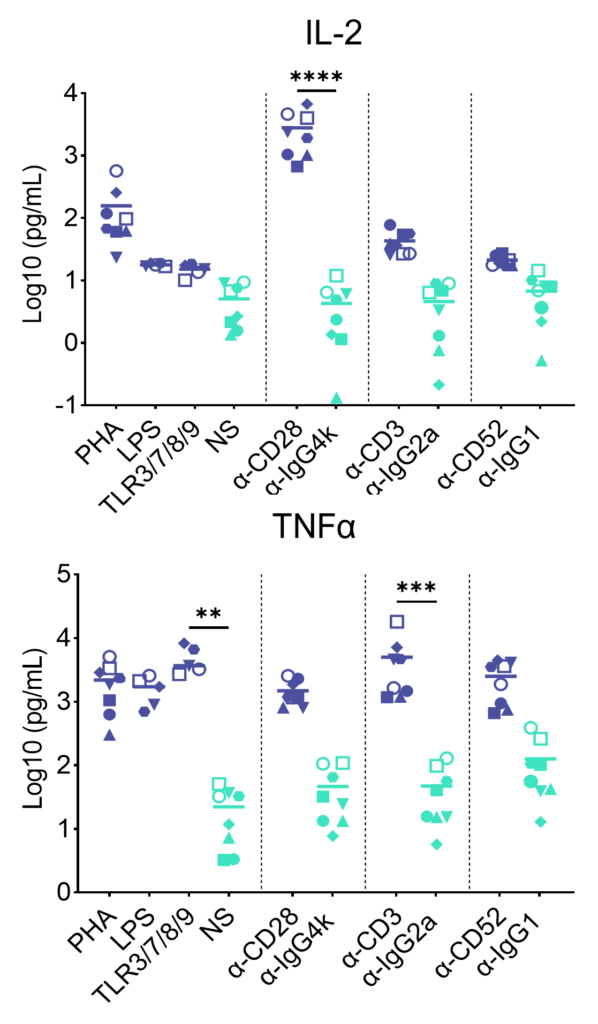
PBMC were added to wells coated with Alemtuzumab, Muromonab, TGN1412 or with isotype control antibodies, to induce cytokine release, or were stimulated with PHA, LPS, or a cocktail of TLR3/7/8/9 agonists. Cytokine release was measured at 48hr post stimulation. NS = Not stimulated. Data shown is mean of a minimum of five donors. Statistics show one way ANOVA with Tukey’s multiple comparisons test. *p<0.05, **p<0.01, ***p<0.001, ****p<0.0001.
Other readouts: IL-8, IL-13, IL-4, IL-12p70, IL-10, IL-1β
Other formats: Whole Blood CRA
Other immuno-tox assays: include ADCC/ CDC/ ADCP
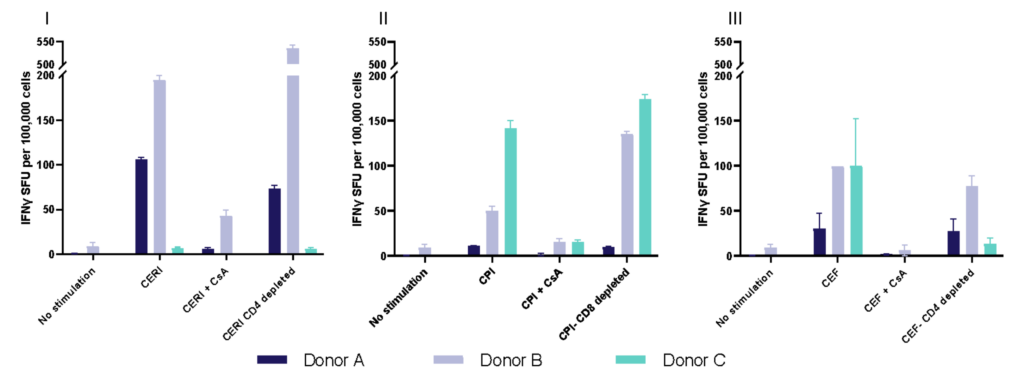
Enzyme-Linked Immuno Spot (ELISpot) is a technique which quantifies rare immune cells that release biomarkers such as cytokines in response to antigenic stimulation. ELISpot is a highly sensitive method to test immune modulators, novel vaccine candidates or de-risk immunogenicity testing in an antigen-specific CD4 and/or CD8 T cell assay.
| Condition | Aim |
| No Stimulation | Negative control |
| PMA | Positive control |
| CERI (CMV, EBV, RSV, Influenza) | MHC-I restricted peptide pool to evaluate modulation of CD8+ T-cell memory response |
| CPI (CMV, Parainfluenza, Influenza) | Positive protein antigens to evaluate modulation of CD4+ T-cell memory response |
| CEF (CMV, EBV, Influenza) | MHC-I restricted peptide pool to evaluate modulation of CD8+ T-cell memory response |
| Cyclosporin A (CsA) | Inhibition of immune response |
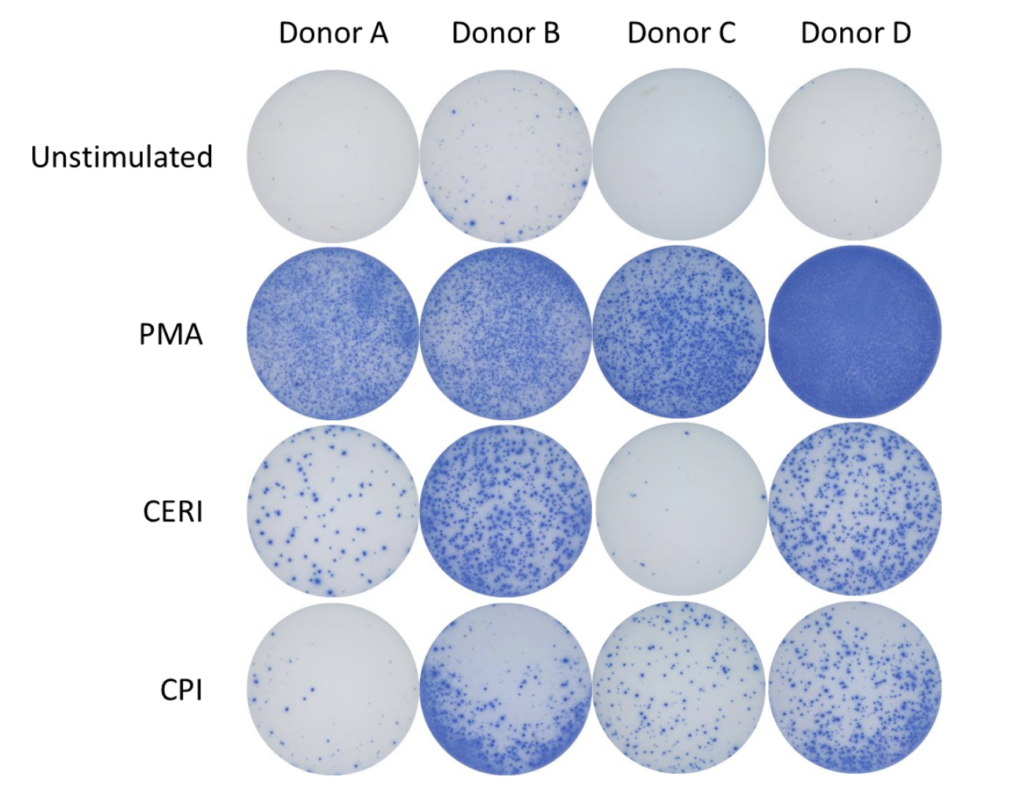
Spot Forming Units (SPU) for IFN-γ per 100,000 PBMC from CERI, CPI and CEF antigens for three donors
Therapeutic modulation of TH17 CD4+ T cell differentiation or effector function
T helper 17 (Th17) cells, are a subset of CD4 T cells distinguished by their production of IL-17. While crucial for protecting the body against extracellular pathogens, Th17 cells have also been implicated in autoimmune disease. Discovering therapies that target either the differentiation or effector function of Th17 cells could therefore prove beneficial for the treatment of some autoimmune diseases.
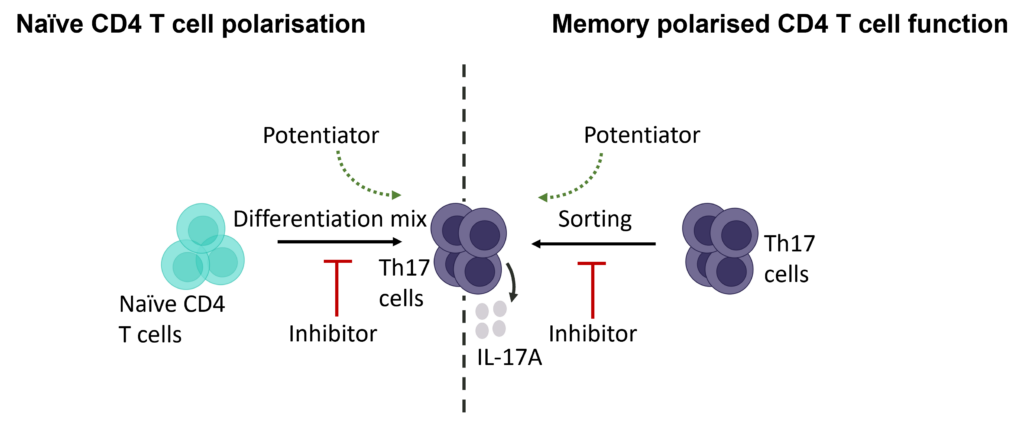
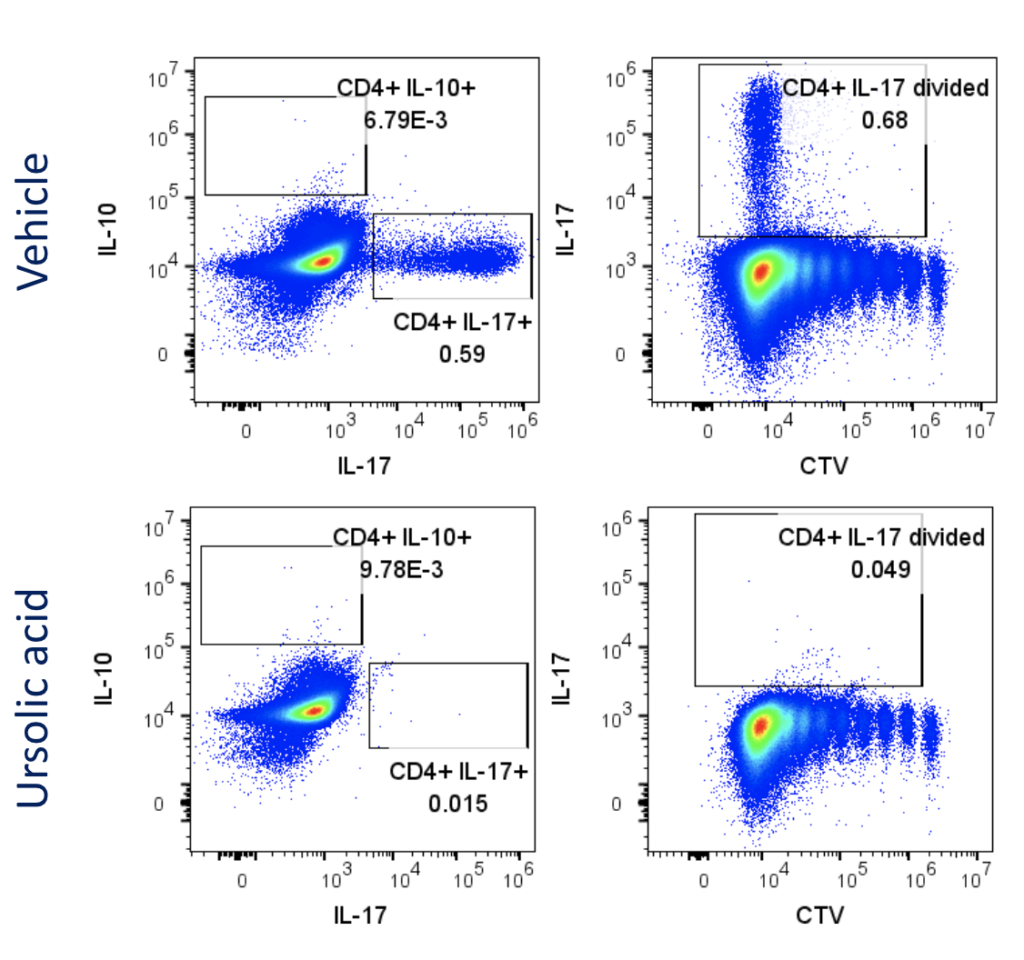
Evaluation of therapeutic modulation of Th17 differentiation
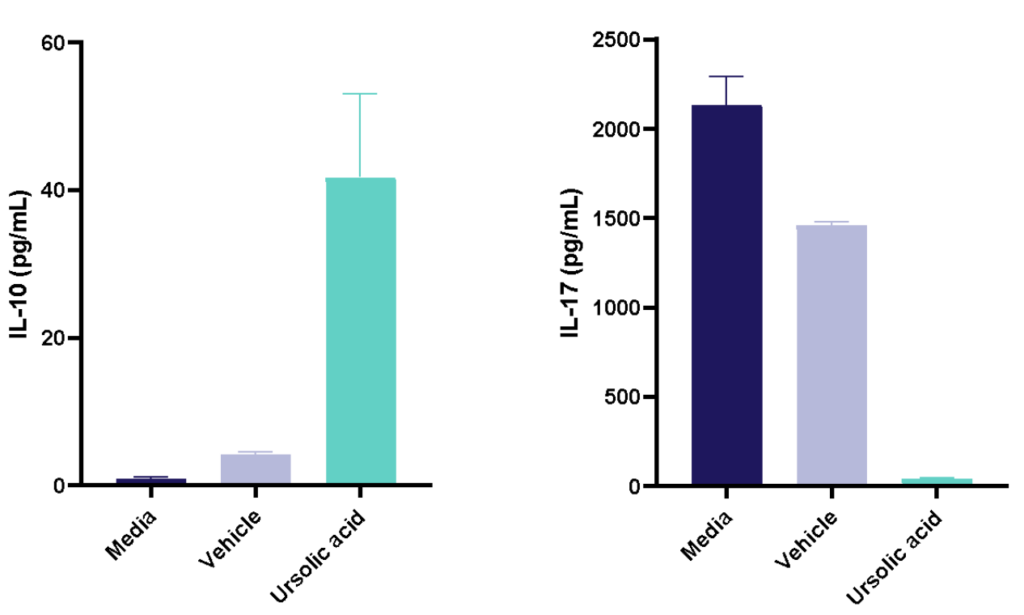
Figure 1: Polarisation of Th17 cells. Naïve CD4 cells were cultured under Th17 polarising conditions for 12 days in the presence or absence of Ursolic Acid. CD4 T cells were assessed for proliferation by CTV dilution; intracellular cytokine staining (ICS) of IL-17 and IL-10 by flow cytometry. On Day 12, Supernatants were collected and evaluated for IL-17 and IL-10 levels by MSD. RoRγT inhibitor Ursolic Acid showed selective inhibition of IL-17 production by intracellular cytokine staining (ICS) and MSD.
Evaluation of therapeutic modulation of Th17 effector function
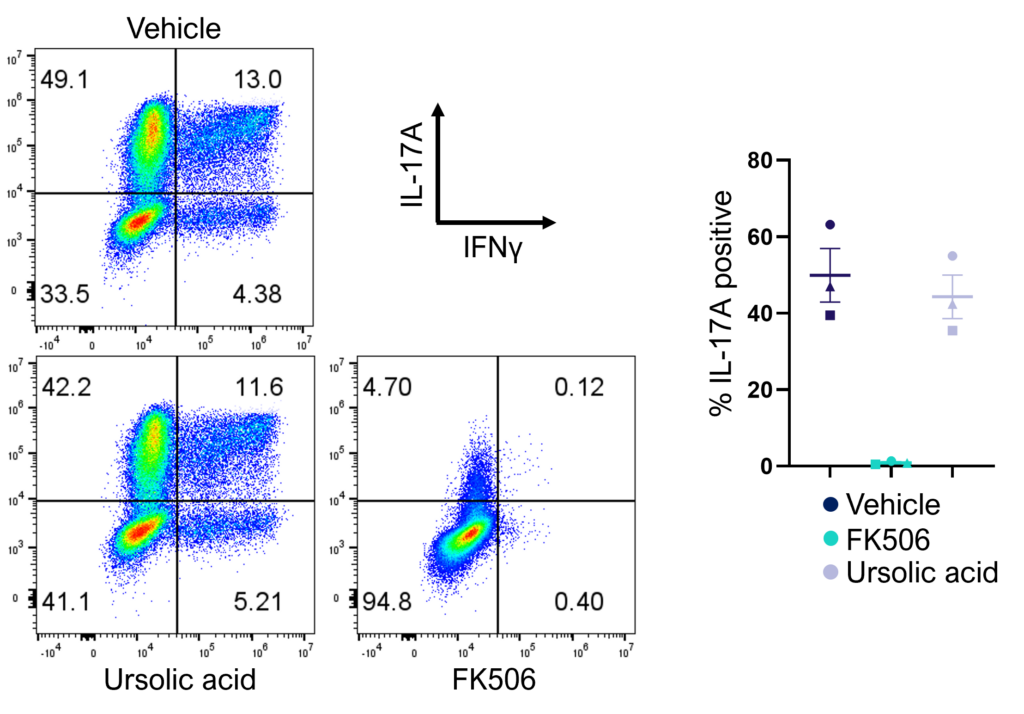
Figure 2: Inhibition of Th17 cell effector function. Magnetically sorted memory Th17 cells were polyclonally stimulated under Th17 conditions in the presence or absence of ursolic acid or FK506 for 5 days. A percentage of Th17 cells are polyfunctional (IL- 17A+IFNg+) and refractory to inhibition by ursolic acid (an inhibitor of Th17 differentiation) but not FK506.
Evaluation of therapeutic modulation of antigen-specific memory T cell responses to recall antigens
I. T cell response to Tetanus Toxoid, Influenza and PPD antigens
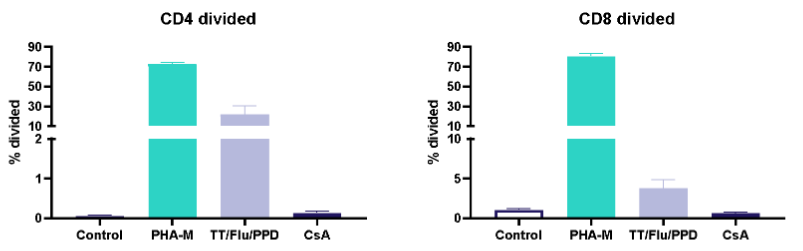
II. Dose response to Influenza antigen
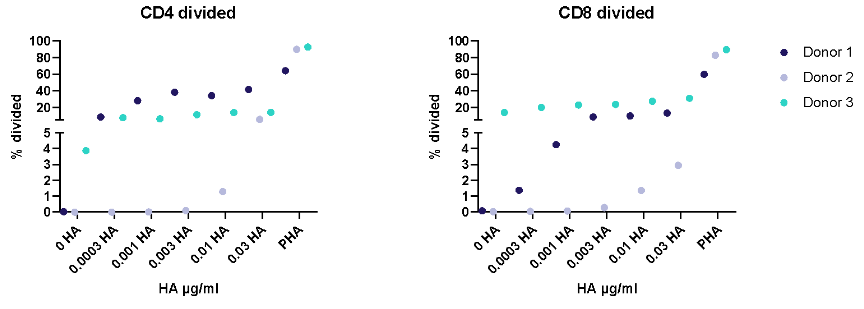
Antigen specific T cells response to a recall antigens. (I) Healthy donors PBMC were stimulated with PHA-M or triple antigen cocktail (Tetanus Toxoid, Influenza and PPD). Cyclosporin was used as a reference treatment. (II) Dose response to Influenza antigen. CD4 and CD8 T cells proliferation was measured by flow cytometry using CTV dilutions.
Enhance T cell effector function: benchmark novel therapies against immune checkpoint blocker (anti-PD-1) in a 1-way MLR

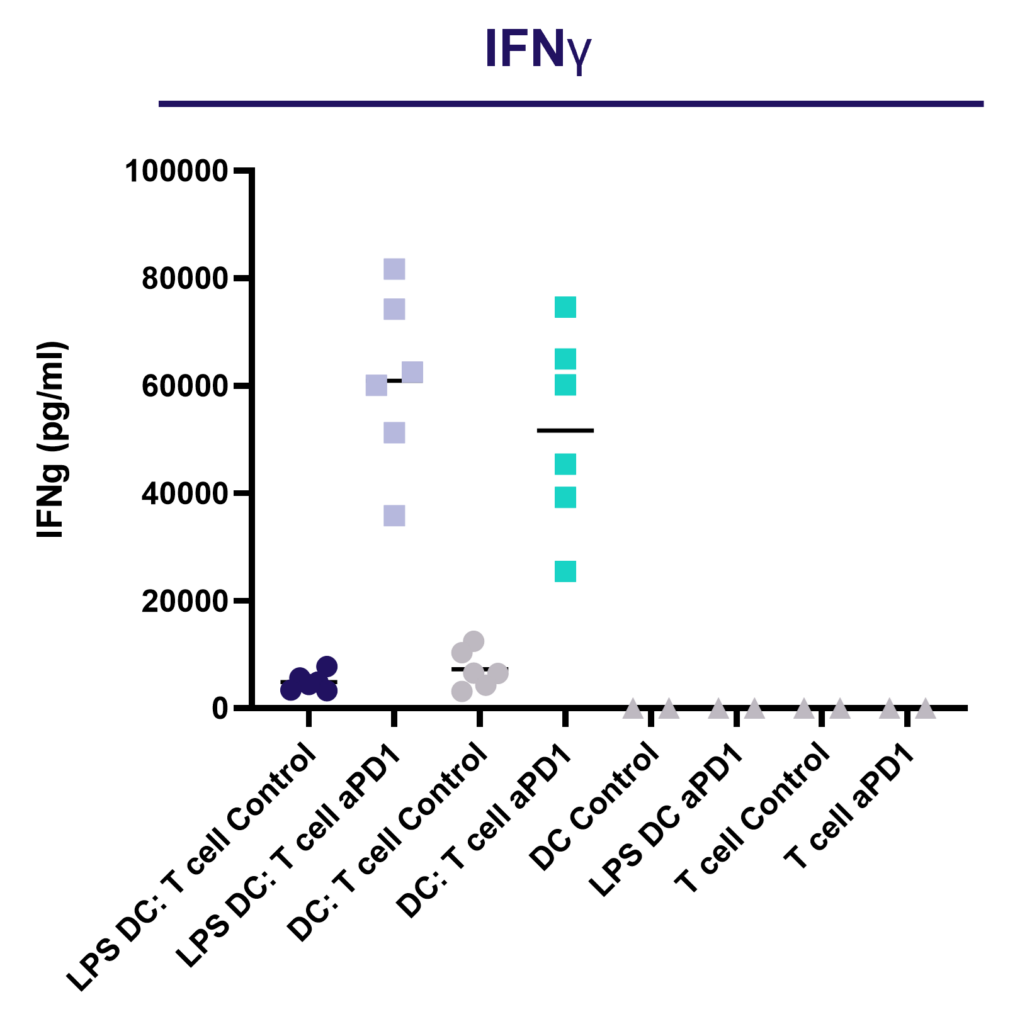
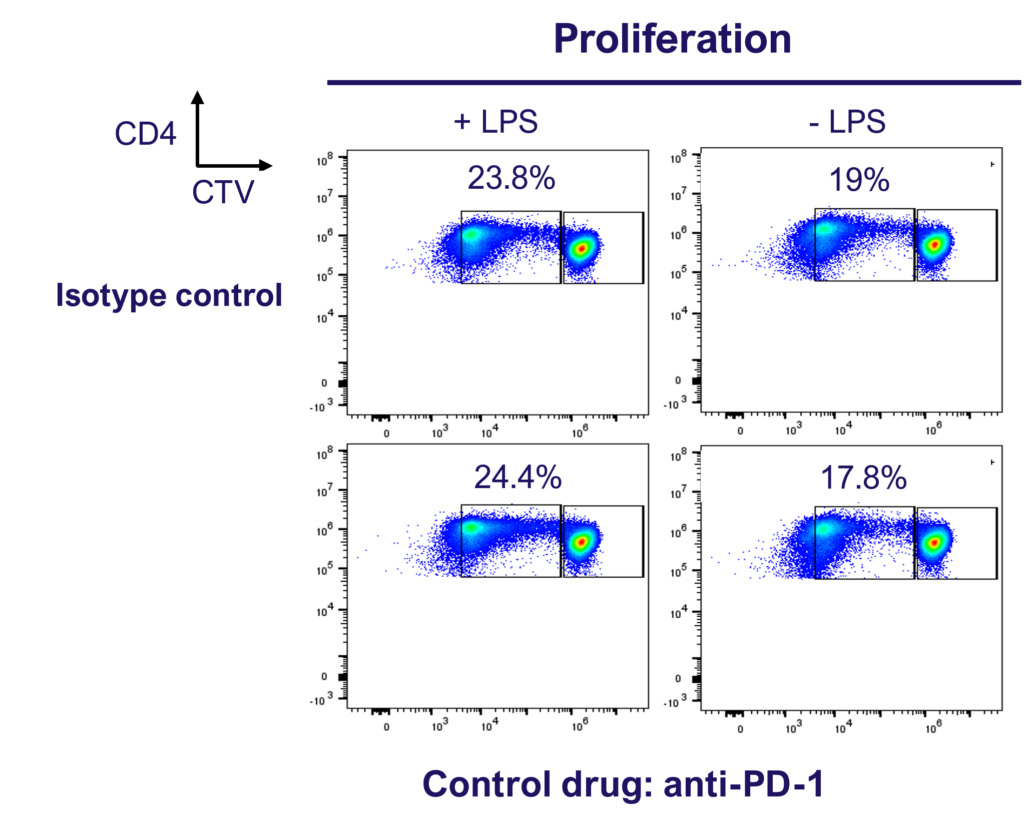
PD-1 blockade does not enhance CD4 T cell proliferation in a 1-way MLR as determined by dye dilution of CTV labelled CD4 T cell using flow cytometry.
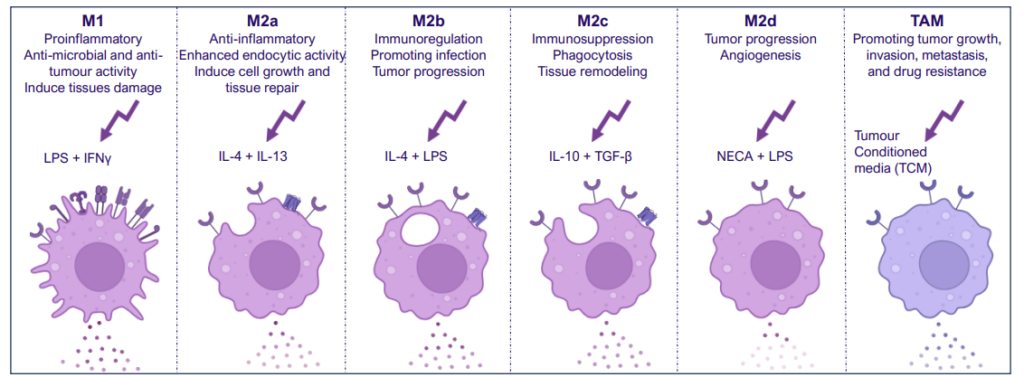
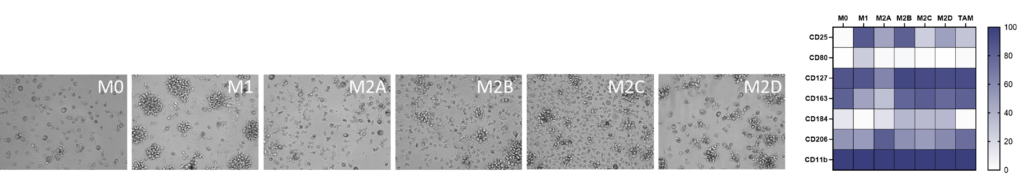
M1/ M2a-d polarisation assay
Monocyte derived macrophages (moMΦ) are differentiated from monocytes isolated from healthy blood donors followed by polarisation into a range of phenotypes M1/ M2a-d and TAM phenotypes using the stimuli described below. Readouts include flow cytometric analysis of surface markers associated with different subsets, production of cytokines and chemokines and ability to phagocytose. Therapeutics can be added at the monocyte to macrophage differentiation phase or polarisation phase to prevent or drive polarisation into a distinct macrophage phenotype.
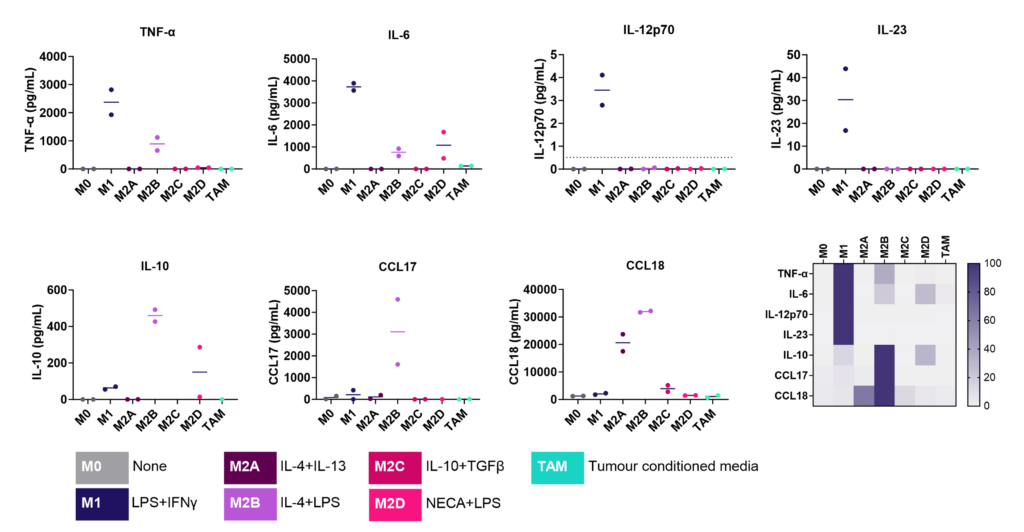
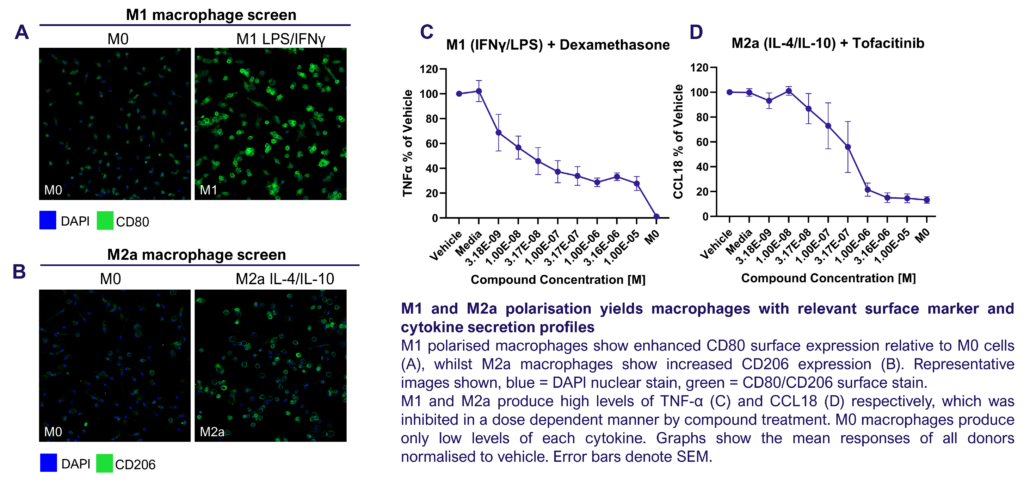
Screening assay to assess modulation of human M1/M2 macrophage function
We present a medium-throughput human macrophage assay to screen novel therapeutics that modulate pro-inflammatory M1 (IFNγ/LPS) and anti-inflammatory M2 (IL-4/IL-10) macrophage subsets. Dexamethasone and tofacitinib are used as reference drugs for benchmarking.
Dysregulated macrophage polarisation exacerbates various diseases. Therapeutics that target macrophage re-polarisation could modify the disease state by shifting macrophages to a beneficial phenotype. For example, promoting an inflammatory M1 phenotype could benefit the tumor microenvironment, while fostering an anti-inflammatory phenotype could help in autoimmune and inflammatory diseases.
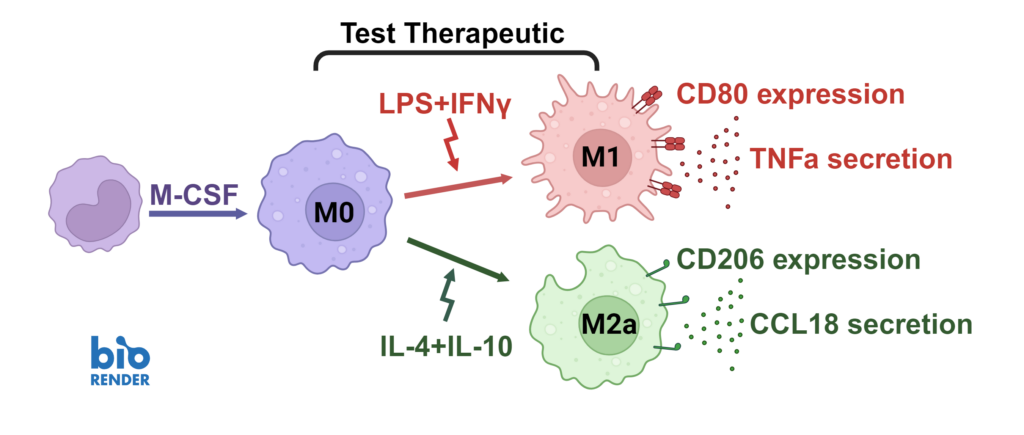
Macrophages were differentiated from monocytes and polarised to M1 or M2a phenotypes following the schema to the left. Polarisation was assessed through CD80 staining and TNFα secretion for M1, and CD206 staining and CCL18 secretion for M2a; staining quantified via HCS analysis. Inhibition of M1 and M2a polarisation was demonstrated using dexamethasone and tofacitinib as reference compounds. Novel therapeutics can be benchmarked against these references.
A THP-1 macrophage cytokine release assay (CRA) can be used to explore modulators of an inflammatory response or “de-risk” any potential unwanted effects of novel therapeutic delivery systems
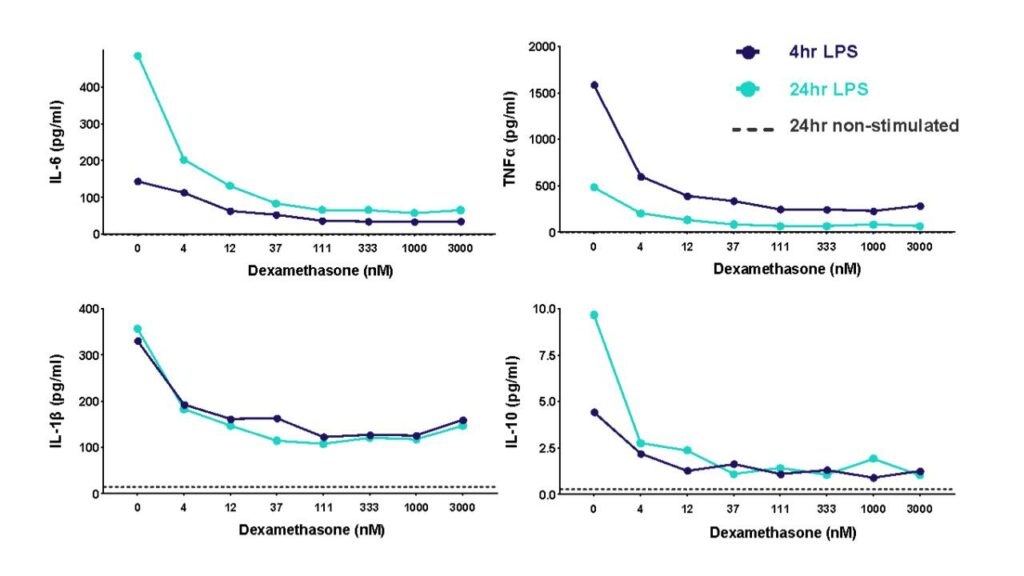
THP-1 cells were differentiated with PMA and then stimulated with LPS to induce cytokine release in the presence of different concentrations of the corticosteroid dexamethasone. Cytokine release was measured at 4h and 24h post LPS stimulation.
Inflammasomes are key signaling platforms within the immune system. Inflammasome complexes form in response to infection, tissue damage or metabolic imbalances. Once formed the inflammasomes activate Caspase 1 which in turn activated the pro-inflammatory cytokines IL-1β and IL-18. Targeting the inflammasome and the resulting signaling pathways is a useful tool in modulating the immune system.
Effect of MCC950 on Inflammasome activation – IL-1β and IL-18.
PBMC from three healthy donors were pretreated with MCC950, vehicle (DMSO) or media for 1 hours prior to stimulation with LPS for 4 hours. Nigericin was then added for a further 45 minutes prior to harvest of the cell culture supernatant for quantification of (A) IL-1β and (B) IL-18 by TR-FRET and ELISA respectively. Data points show mean +/- SEM of technical replicates. One-way ANOVA with Dunnett’s multiple comparisons test comparing stimulated (media) to unstimulated, LPS alone, vehicle and MCC950 to vehicle; *<0.05, **<0.01, ***<0.001.
Other formats: PBMC, macrophage subsets, microglia
THP-1 macrophage cell line phagocytosis and efferocytosis
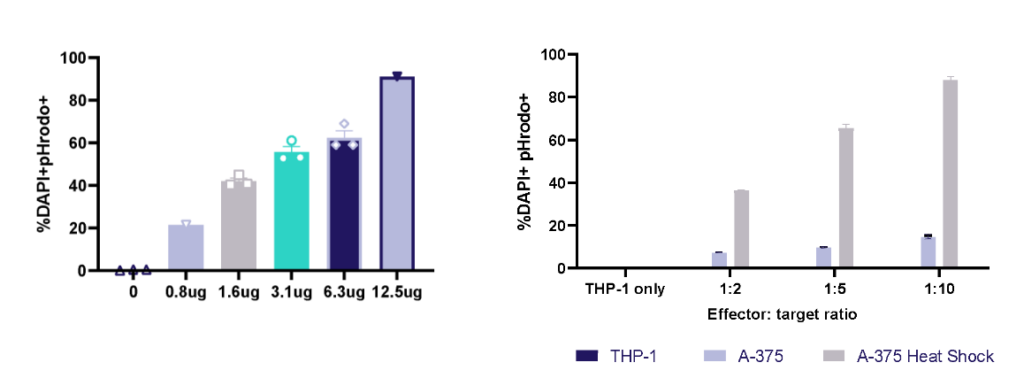
THP-1 macrophage phagocytosis of E.Coli bioparticles and efferocytosis of Heat Shock treated A-375 melanoma tumour cells. THP-1 cells were cultured with E.Coli bioparticles 0-12.5ug/ml; at 1h phagocytosis was evaluated by pHrodo+ cells using flow cytometry. THP-1 cells were cultured with three E:T ratios of A-375 or heat shock treated A-375; at 1h efferocytosis was evaluated by pHrodo+ cells using flow cytometry.
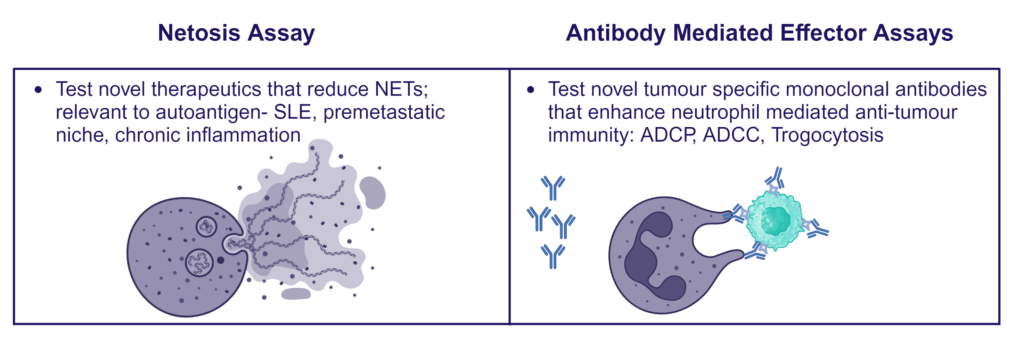
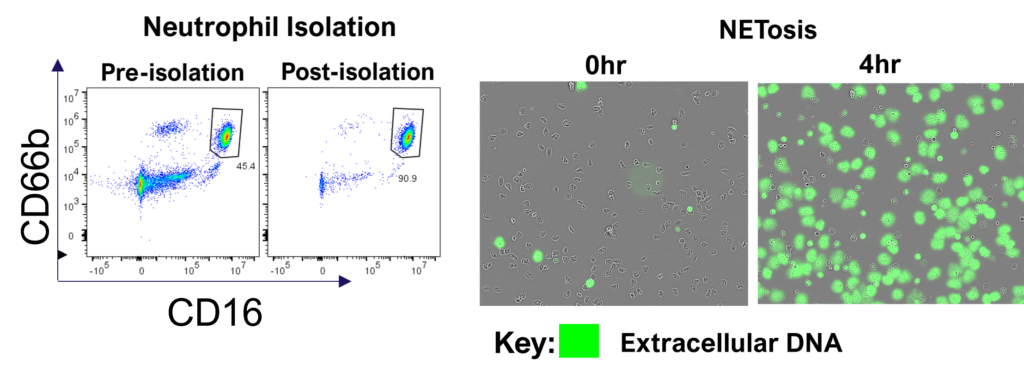
Therapeutic blocking of NETosis and enhancement of neutrophil phagocytosis/trogocytosis
Neutrophils are armed with a variety of effector mechanisms, they release neutrophil extracellular traps (NETs), comprising of chromatin and antimicrobial proteins which are released via a unique, pro-inflammatory form of cell death called NETosis. Dysregulated NET release can damage the host, contributing to autoimmune diseases such as Systemic Lupus Erythematosus (SLE) by the release of autoantigens. Similarly, dysregulated NET release contributes to diseases such as atherosclerosis, deep vein thrombosis and has been shown to promote cancer progression and metastasis. Modulating neutrophil function is therefore a potential therapeutic intervention.