
CD8+ T cell
Immune-Oncology Assays
- 2D/ 3D Tumour Killing Assay (panel of tumour cells available)
- Antigen-specific CTL-CEFT (phenotype, proliferation, degranulation)
- MART-1 specific CTL- cytotoxicity
- T cell exhaustion
Autoimmunity Assays
- Activation
- Proliferation and function
Assays
3D immune mediated Tumour Killing Models: Tools for screening immune or tumour targeted therapeutics
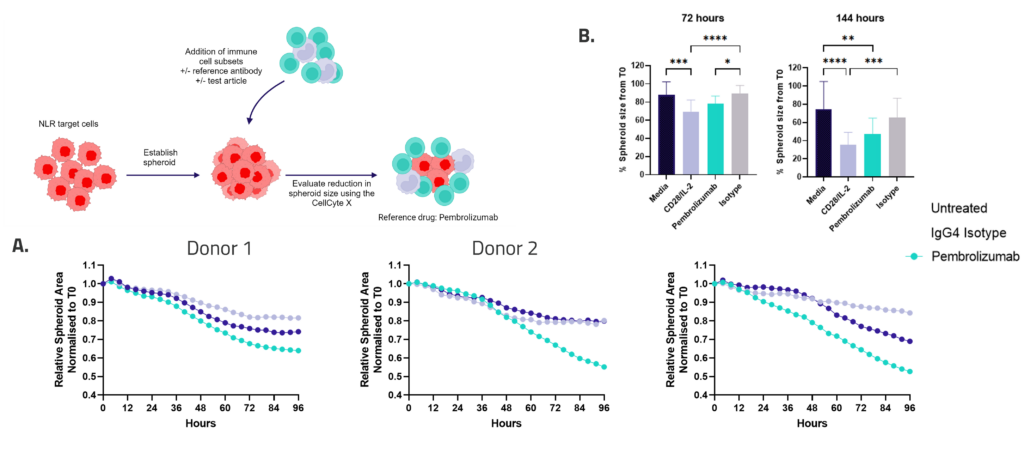
Figure 1: SKOV-3 NLR tumour cells were seeded into 96 well plates, PBMC were added once spheroids were established in the presence of Pembrolizumab or IgG4 control or vehicle (untreated) and imaged every 4 hours for 96 hours using the CellCyte X. Relative spheroid area (%) was measured (A). AUC statistics were calculated using GraphPad Prism v9.5.0
ELISpot is a highly sensitive method to test immune modulators, novel vaccine candidates or de-risk immunogenicity testing in an antigen-specific CD4 and/or CD8 T cell assay.
| Condition | Aim |
| No Stimulation | Negative control |
| PMA | Positive control |
| CERI (CMV, EBV, RSV, Influenza) | MHC-I restricted peptide pool to evaluate modulation of CD8+ T-cell memory response |
| CPI (CMV, Parainfluenza, Influenza) | Positive protein antigens to evaluate modulation of CD4+ T-cell memory response |
| CEF (CMV, EBV, Influenza) | MHC-I restricted peptide pool to evaluate modulation of CD8+ T-cell memory response |
| Cyclosporin A (CsA) | Inhibition of immune response |
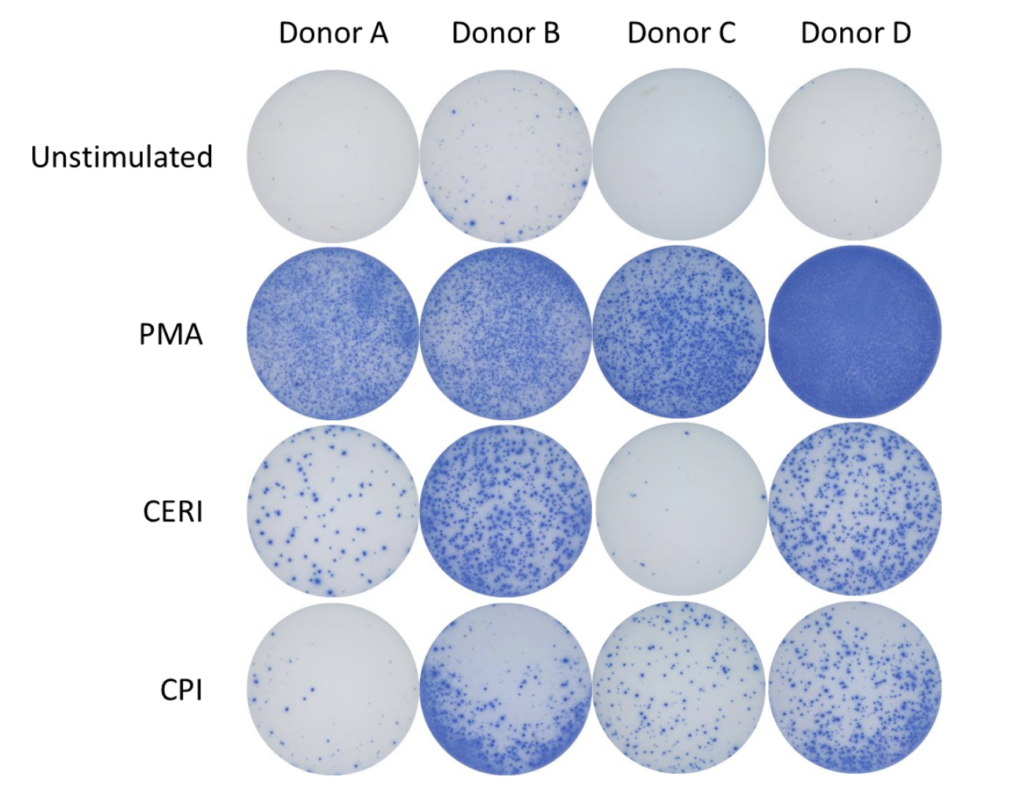
Figure 1: The ELISpot visual image results showing four donors under four conditions: Unstimulated (negative control), stimulated with PMA (positive control), stimulated with CERI, and stimulated with CPI antigens. Each purple spot represents one IFNγ producing cell.
Spot Forming Units (SPU) for IFN-γ per 100,000 PBMC from CERI, CPI and CEF antigens for three donors
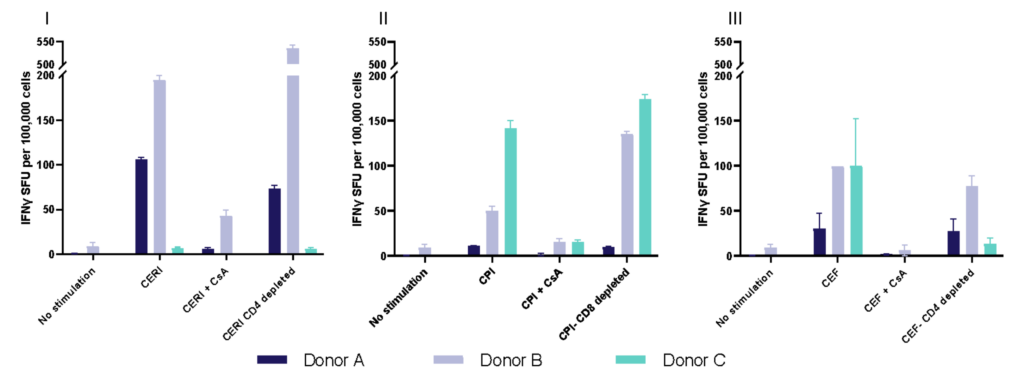
Figure 2: T cell responses from three donors using stimuli, CERI (I), CPI (II) and CEF (III). Expressed as spot forming units per 100,000 donor PBMC. Depletion of CD4 or CD8 T cells demonstrates specificity of response to peptide pools. Each value represents the mean of triplicate wells ±SEM.
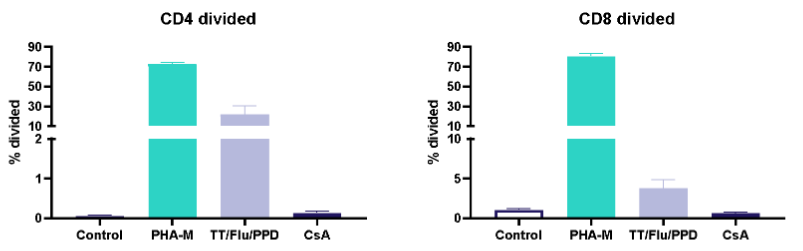
I. T cell response to Tetanus Toxoid, Influenza and PPD antigens
II. Dose response to Influenza antigen
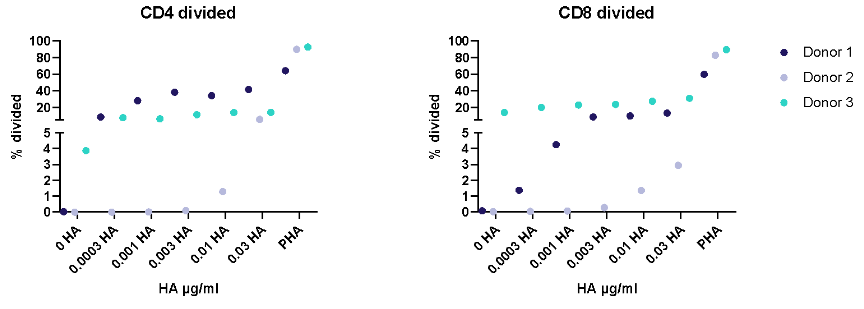
Antigen specific T cells response to a recall antigens. (I) Healthy donors PBMC were stimulated with PHA-M or triple antigen cocktail (Tetanus Toxoid, Influenza and PPD). Cyclosporin was used as a reference treatment. (II) Dose response to Influenza antigen. CD4 and CD8 T cells proliferation was measured by flow cytometry using CTV dilutions.
Dendritic Cell
Immune-Oncology Assays
- Antigen uptake and vaccine delivery
- Cross presentation
- Neo-antigen immunogenicity; phenotyping,
Autoimmunity Assays
- Antigen presentation
Assays
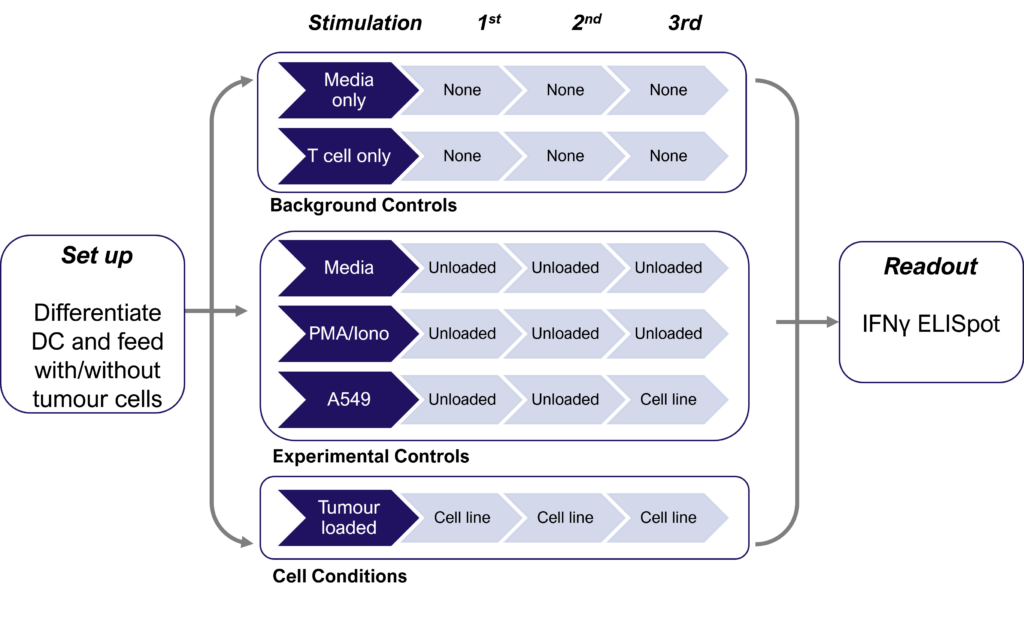
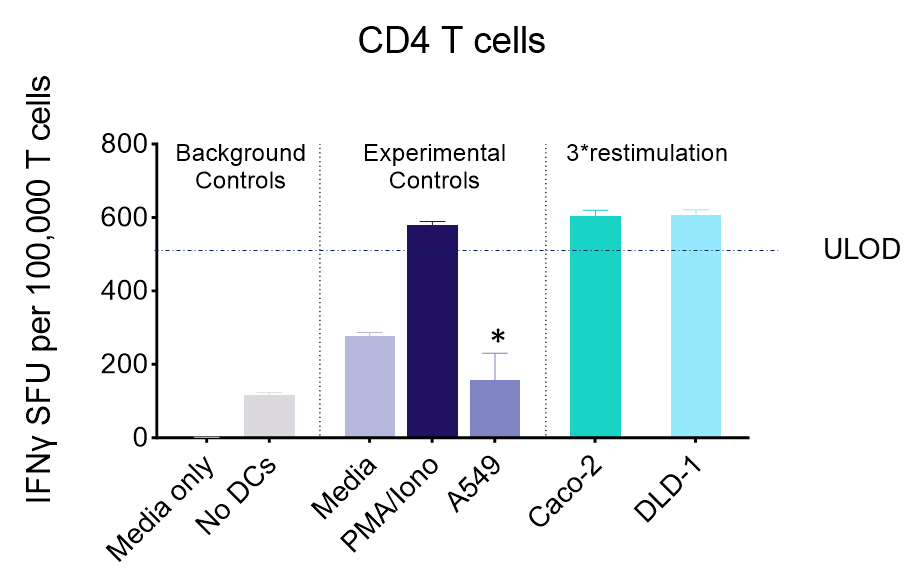
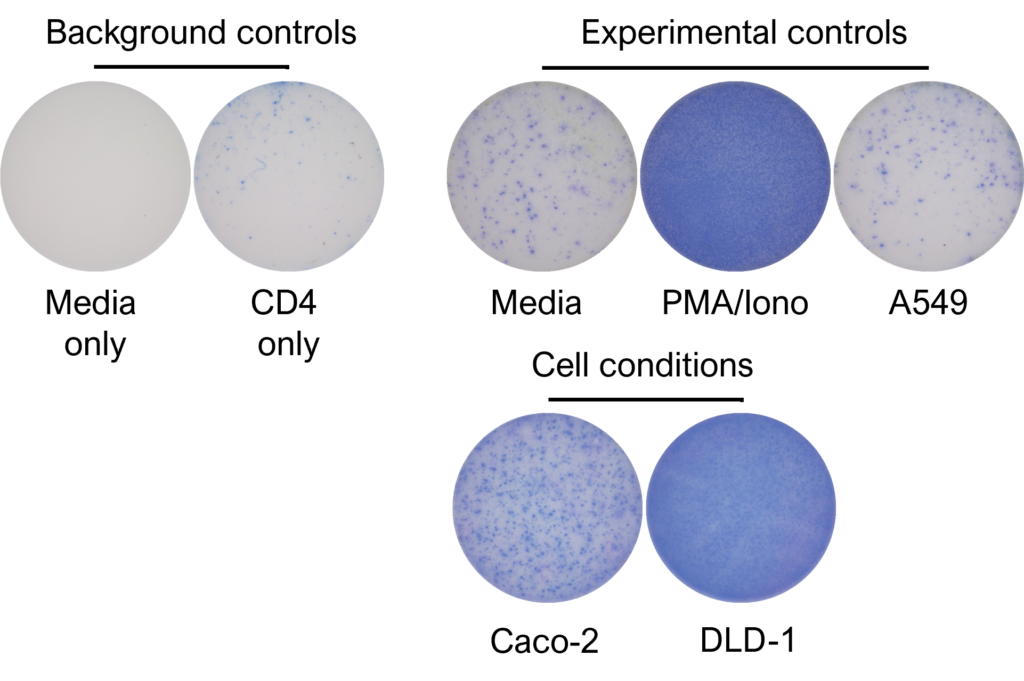
Therapies targeting the modification of tumor cells to increase neoantigen expression and improve immune cell recognition are currently under development. Detecting these subtle changes typically involves several cycles of dendritic cell restimulation of T cells, followed by the sensitive measurement of rare neoantigen-specific T cell responses using IFNγ ELISPOT assays. The schematic below shows the assay design with multiple round of dendritic cell (DC) restimulation to expand rare neoantigen T cell responses.
IFNγ release from activated tumour neoantigen-specific CD4 T cells
IFNγ release from activated tumour neoantigen-specific naive CD8 T cells
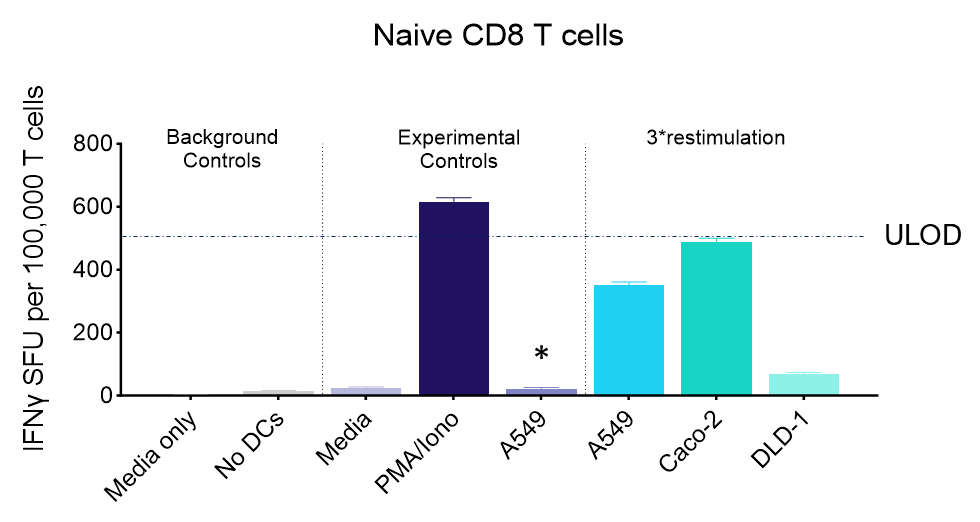
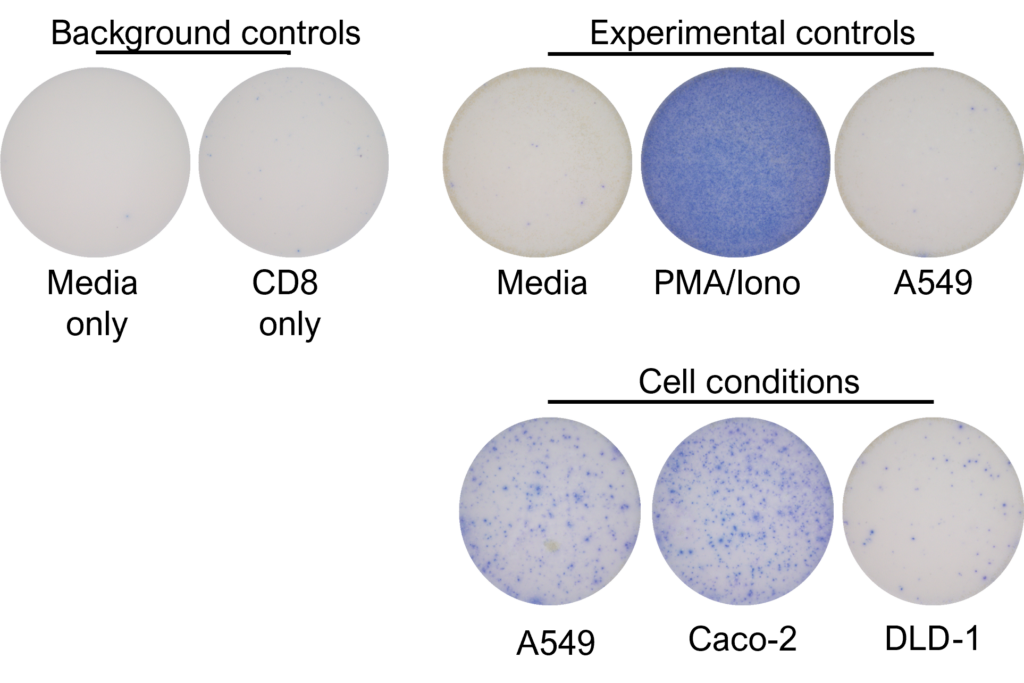
Figures: CD4 or naïve CD8 T cells were co-cultured with unloaded dendritic cells (DC), or with DC loaded with tumour cells that had been previously treated with media or vehicle. Three rounds of stimulation of T cells with DC were performed (* single round of DC stimulation). PMA and ionomycin were added as positive controls during the final round of stimulation. T cell stimulation was assessed by measuring the number of spot forming units (SFU) by IFNγ ELISpot. Media and T cell only wells were included as background controls. Number of SFU per 100,000 plated T cells, with mean of two (experimental controls) or three (all others) replicates ± SEM shown. Representative images of CD4 and naïve CD8 T cell IFNγELISpot. Each blue dot represents one IFNγ-producing T cell. ULOD = Upper Limit of Detection
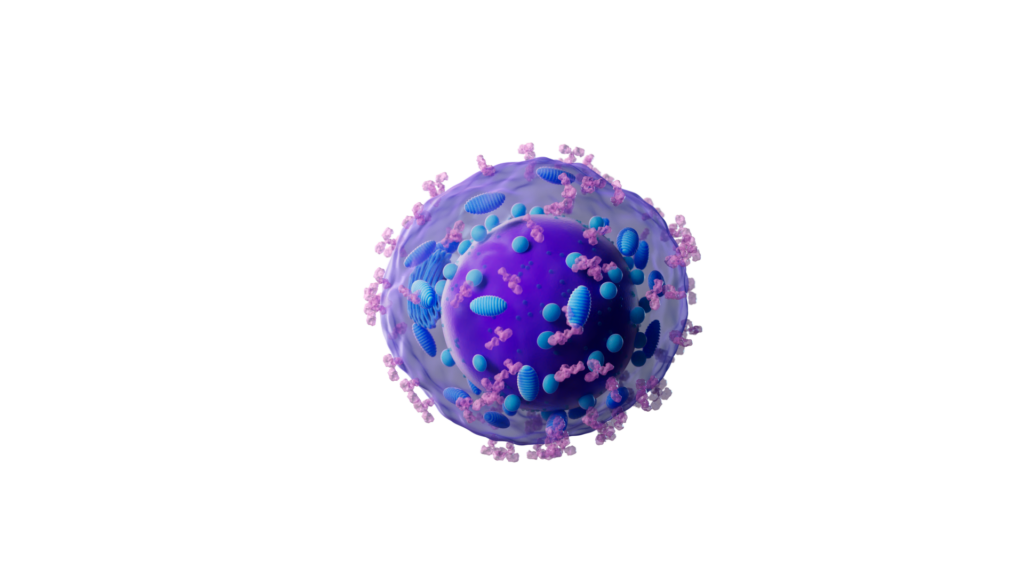
B cell
Autoimmunity Assays
- Antibody production (Total IgG)
- Memory B cell Antibody Isotypes
- Naïve B cells Isotype switching
- B cell proliferation/activation/cytokine secretion
- Antigen presentation
Assays
Tonsils are a secondary lymphoid tissue rich in B cell subsets and the specialized, anatomically restricted T follicular helper (Tfh) subset of CD4 T cells. Tonsils provide an accessible source of cells for those interested in B cell immunology, Tfh biology and vaccine development. The tonsillar cell re-aggregate model provides functional insight into human germinal center biology, allowing measurement of key features including naive B cell differentiation, plasma cell/plasmablast differentiation, and antibody production.

Figure A. Schematic representation of tonsil re-aggregate model. Cells are seeded at high density in 96 well plates; unstimulated (US) or stimulated with quadrivalent inactivated influenza vaccine (IIV) in the presence of vehicle or reference inhibitors such as Rapamycin. B cell readouts include B cell phenotyping, B cell proliferation and hemagglutinin (HA)-specific IgG by ELISPOT or ELISA.
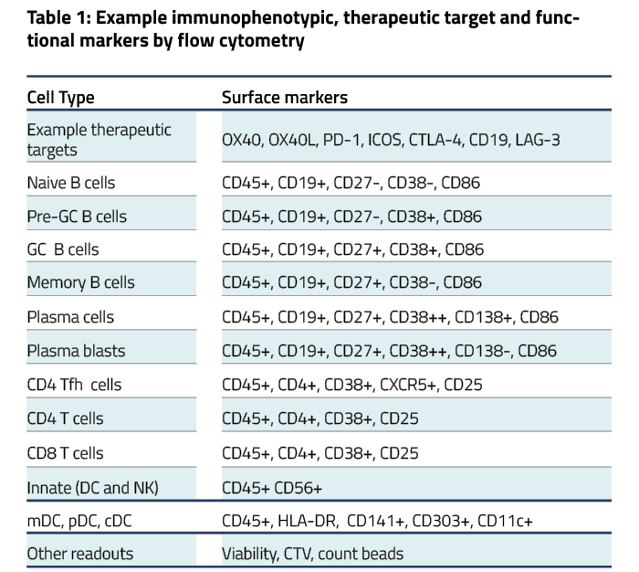
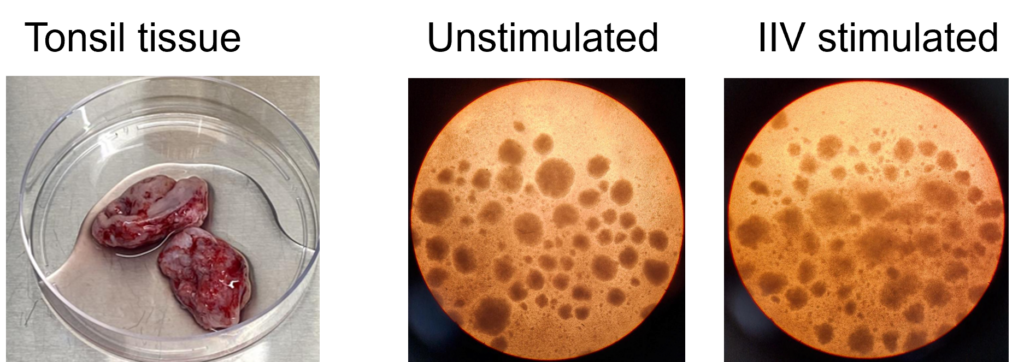
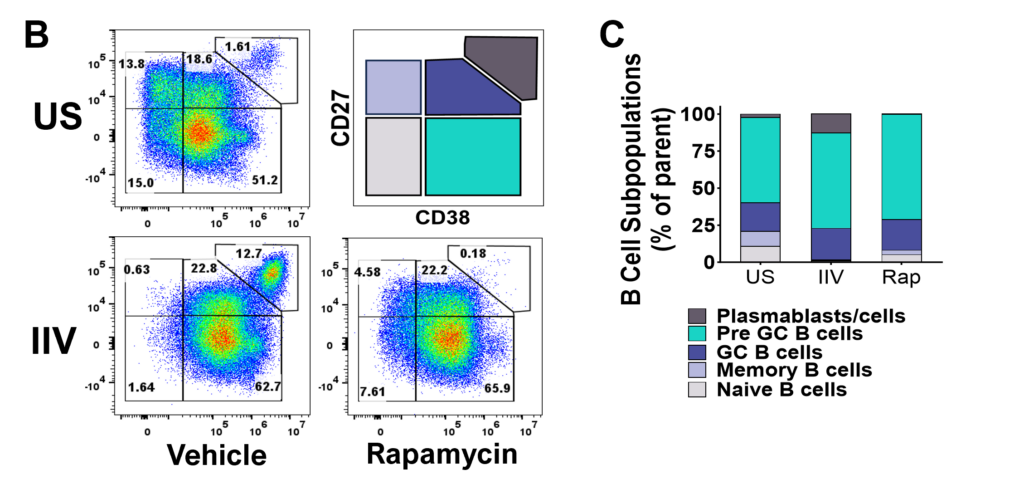
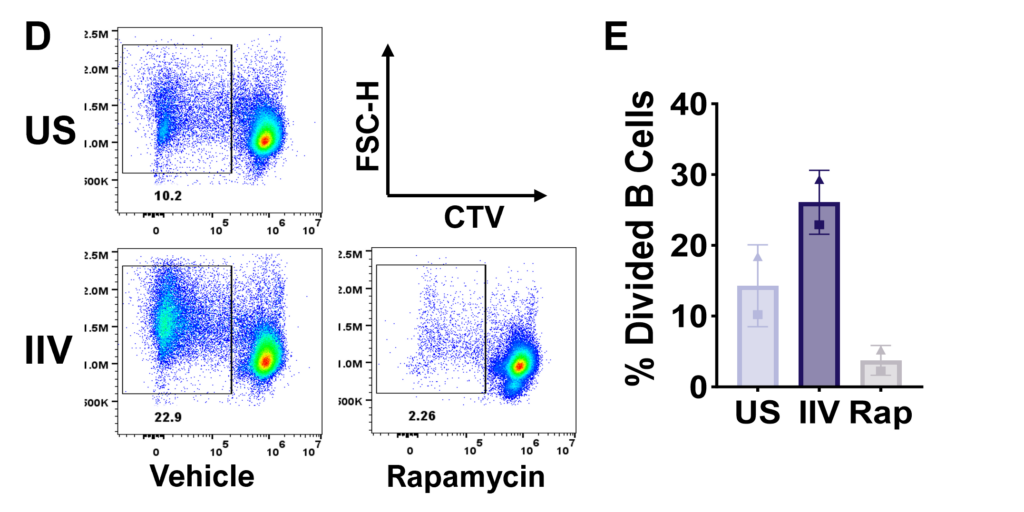
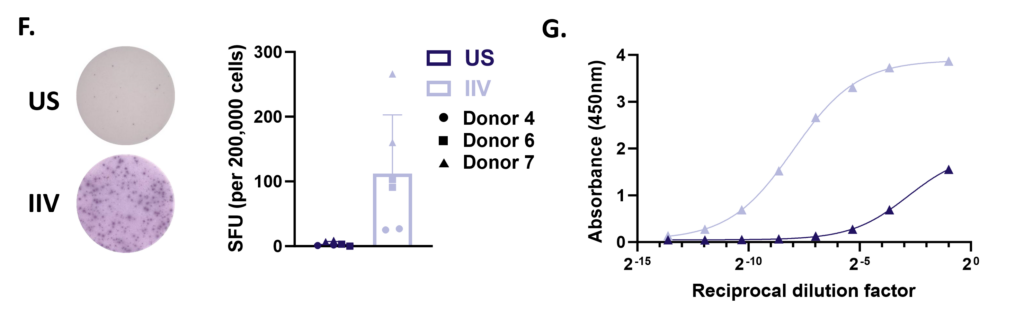
Figure F. HA-specific IgG production on day 7 measured by ELISpot. Representative images from one donor (left) and bar graph showing spot forming units (SFU) per 200,000 cells from 3 pre-selected IIV responsive donors run in duplicate wells (right). G. HA-specific IgG secretion on day 12 by ELISA. Representative dilution curves from one donor
Peripheral blood B cells can be stimulated with T-independent and T-dependent stimuli driving effector functions such as B cell activation, proliferation, Ig production and Ig class switching. Therapeutic intervention using pan or B cell suppressants – Rapamycin, Cyclosporin A or BTK inhibitor Ibrutinib respectively modify B cell function. Other B cell readouts such as downstream signaling following BcR cross linking and B cell antigen presentation to T cells can be assessed.
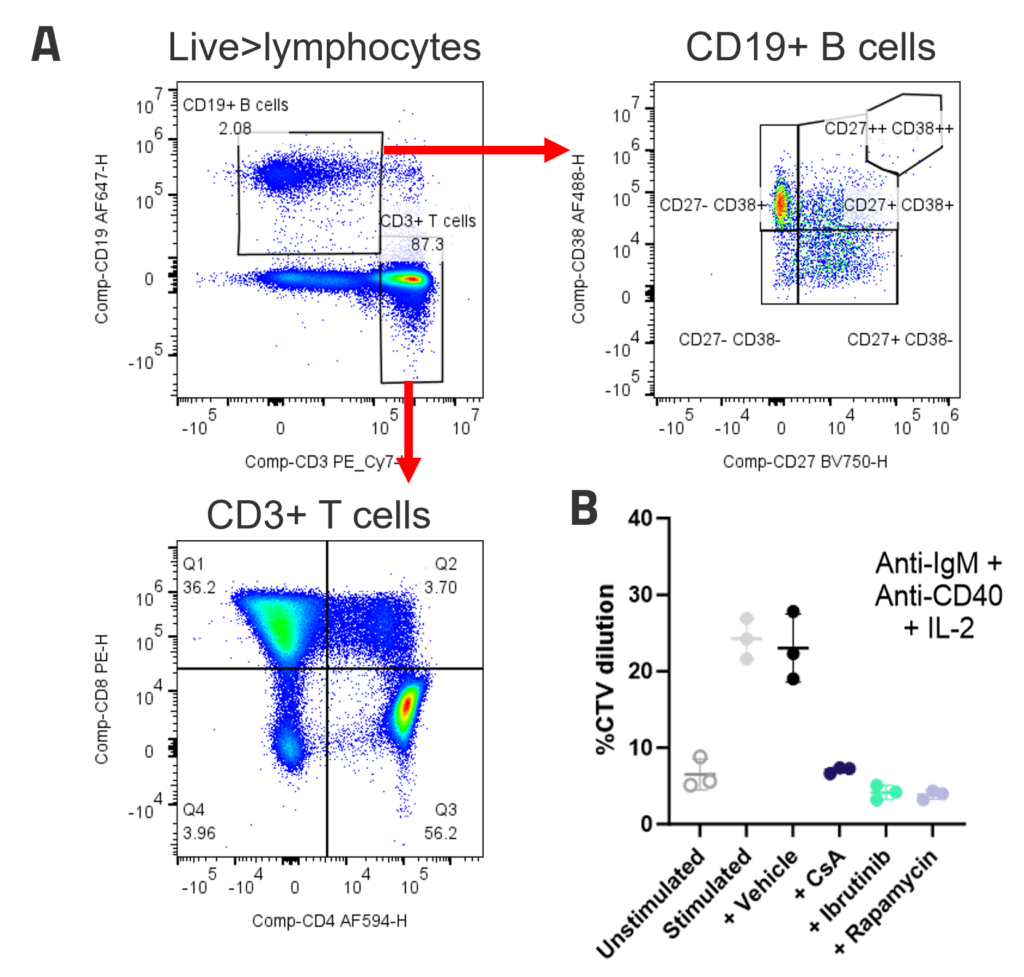
A. Peripheral blood B cells constitute around 2-5% of PBMC and contain predominantly naïve (CD27-CD38+) and memory (CD27+CD38-) populations. Example B and T cell profiles in unstimulated PBMC (B) B cell proliferation to polyclonal T dependent stimuli. PBMC were stimulated with anti-IgM + anti-CD40+ IL-2. Graphs show B cell %CTV dilution as a measure of proliferation Stimulation was performed in the presence or absence of inhibitors; FK506, Ibrutinib or Rapamycin. Bars indicate mean +/- SD, n = 3 donors.
B cell depletion is reported to not only have the potential to alter levels of auto-antibodies but also the immune milieu – B cells produce many soluble mediators which impact on other immune cell types such as T cells and DC, so depletion of B cells has the potential to regulate other subsets involved in the disease process. Alemtuzumab was used to show NK cell mediated B cell depletion further examples using Rituximab are available.
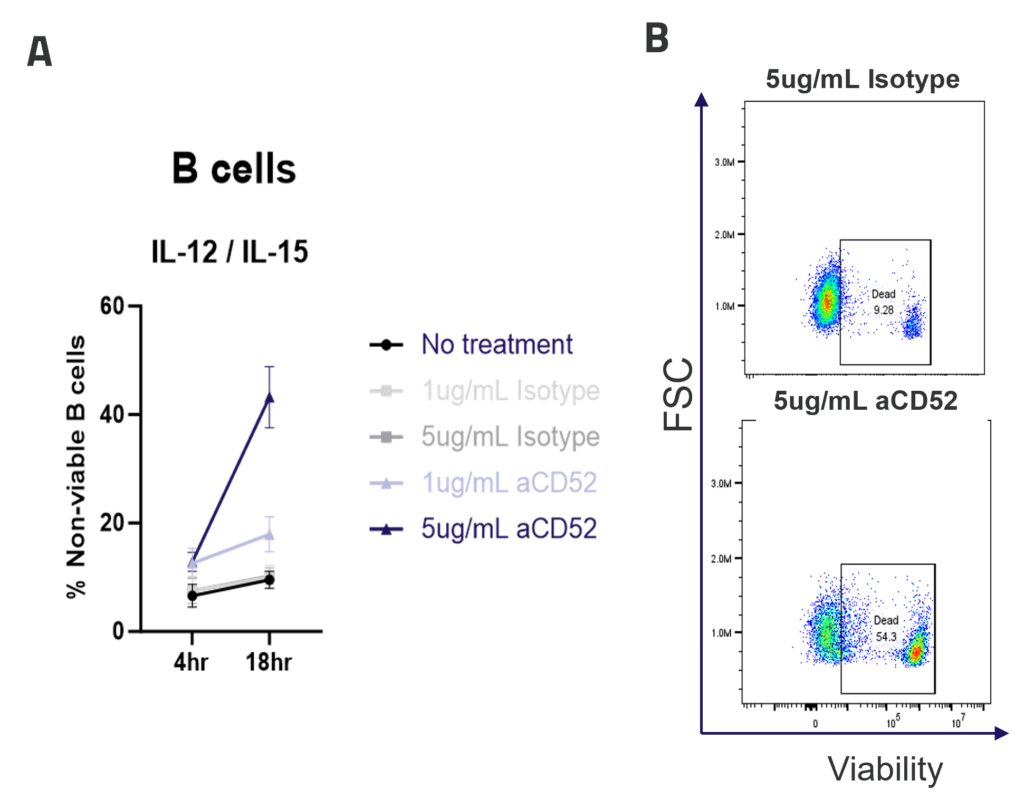
A. ADCC mediated B cell depletion. PBMCs were rested overnight with IL-12/IL-15 pre-activation, before addition of IgG1 isotype control or anti-CD52 Alemtuzumab (1ug/mL, 5ug/mL). The viability of CD4, CD8 and B cells (A) was measured by flow cytometry after 4 or 18hr of culture. Graphs show mean +/- SEM, n = 3 donors. Representative dot plots (B) show B cell viability after 18hr of culture.
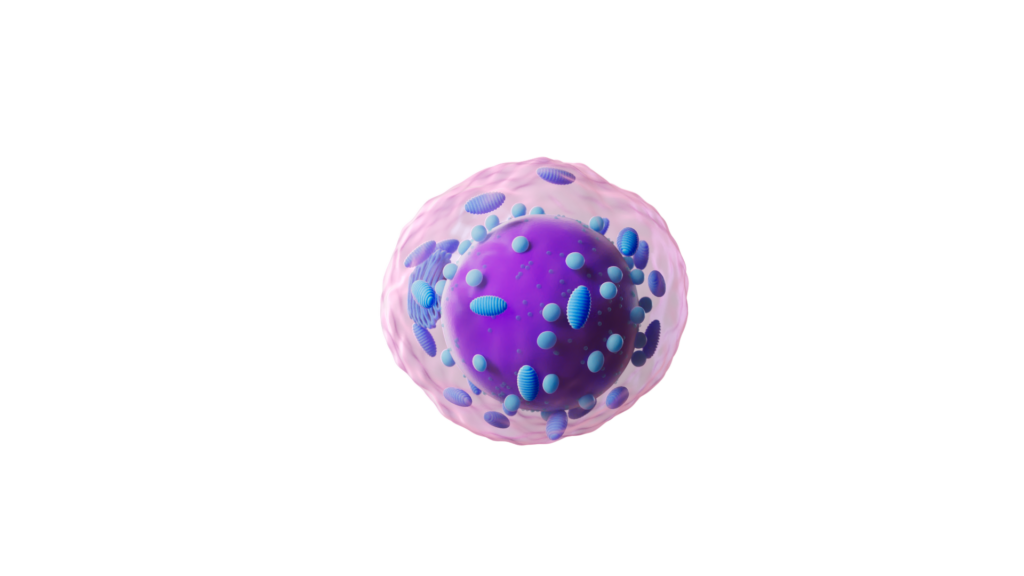
CD4+ T cell
Immune-Oncology Assays
- Polyclonal
- MLR
- Antigen specificity
- nTreg suppression assay
- iTreg polarisation assay
Autoimmunity Assays
- Th1/2/17 polarisation
- Th17 function
- Tr1/iTreg polarisation
- nTreg suppression
- Tfh, naïve
- CM and EM phenotype/function
- Polyclonal T cell proliferation
- Cytokine release
Inflammation Assays
- Cytokine release
Assays
ELISpot is a highly sensitive method to test immune modulators, novel vaccine candidates or de-risk immunogenicity testing in an antigen-specific CD4 and/or CD8 T cell assay.
| Condition | Aim |
| No Stimulation | Negative control |
| PMA | Positive control |
| CERI (CMV, EBV, RSV, Influenza) | MHC-I restricted peptide pool to evaluate modulation of CD8+ T-cell memory response |
| CPI (CMV, Parainfluenza, Influenza) | Positive protein antigens to evaluate modulation of CD4+ T-cell memory response |
| CEF (CMV, EBV, Influenza) | MHC-I restricted peptide pool to evaluate modulation of CD8+ T-cell memory response |
| Cyclosporin A (CsA) | Inhibition of immune response |
Figure 1: The ELISpot visual image results showing four donors under four conditions: Unstimulated (negative control), stimulated with PMA (positive control), stimulated with CERI, and stimulated with CPI antigens. Each purple spot represents one IFNγ producing cell.
Spot Forming Units (SPU) for IFN-γ per 100,000 PBMC from CERI, CPI and CEF antigens for three donors
Figure 2: T cell responses from three donors using stimuli, CERI (I), CPI (II) and CEF (III). Expressed as spot forming units per 100,000 donor PBMC. Depletion of CD4 or CD8 T cells demonstrates specificity of response to peptide pools. Each value represents the mean of triplicate wells ±SEM.
T helper 17 (Th17) cells, are a subset of CD4 T cells distinguished by their production of IL-17. While crucial for protecting the body against extracellular pathogens, Th17 cells have also been implicated in autoimmune disease. Discovering therapies that target either the differentiation or effector function of Th17 cells could therefore prove beneficial for the treatment of some autoimmune diseases.
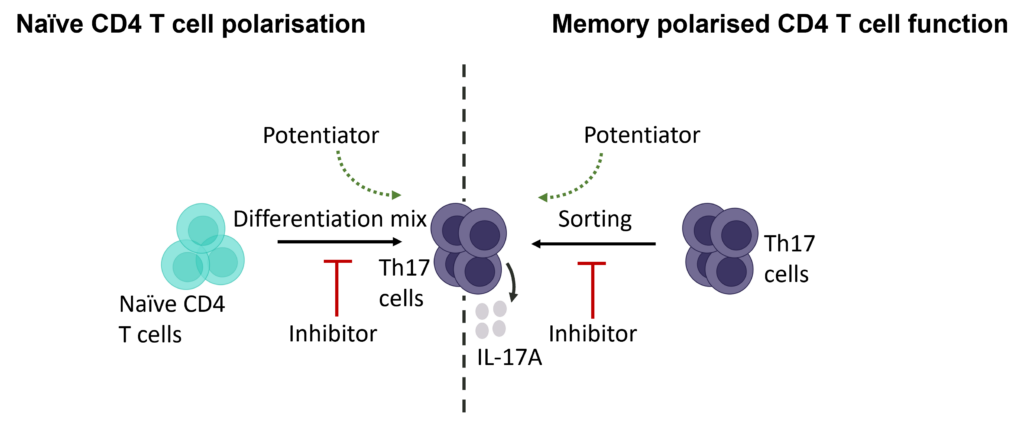
Evaluation of therapeutic modulation of Th17 differentiation
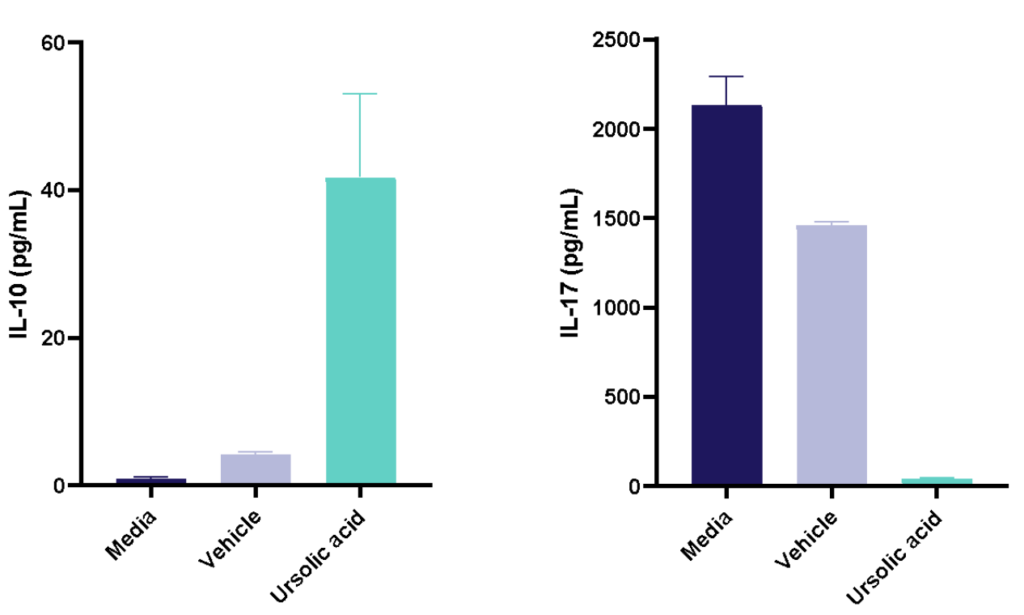
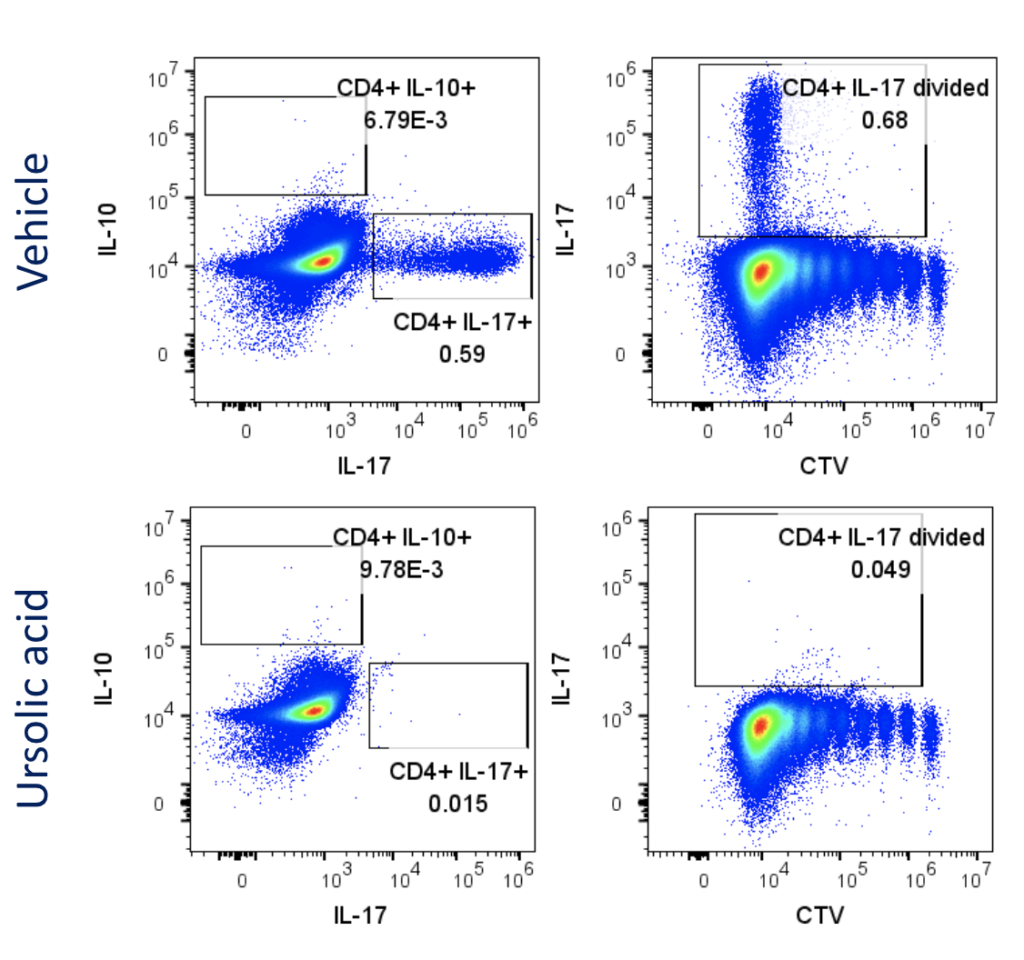
Figure 1: Polarisation of Th17 cells. Naïve CD4 cells were cultured under Th17 polarising conditions for 12 days in the presence or absence of Ursolic Acid. CD4 T cells were assessed for proliferation by CTV dilution; intracellular cytokine staining (ICS) of IL-17 and IL-10 by flow cytometry. On Day 12, Supernatants were collected and evaluated for IL-17 and IL-10 levels by MSD. RoRγT inhibitor Ursolic Acid showed selective inhibition of IL-17 production by intracellular cytokine staining (ICS) and MSD.
Evaluation of therapeutic modulation of Th17 effector function
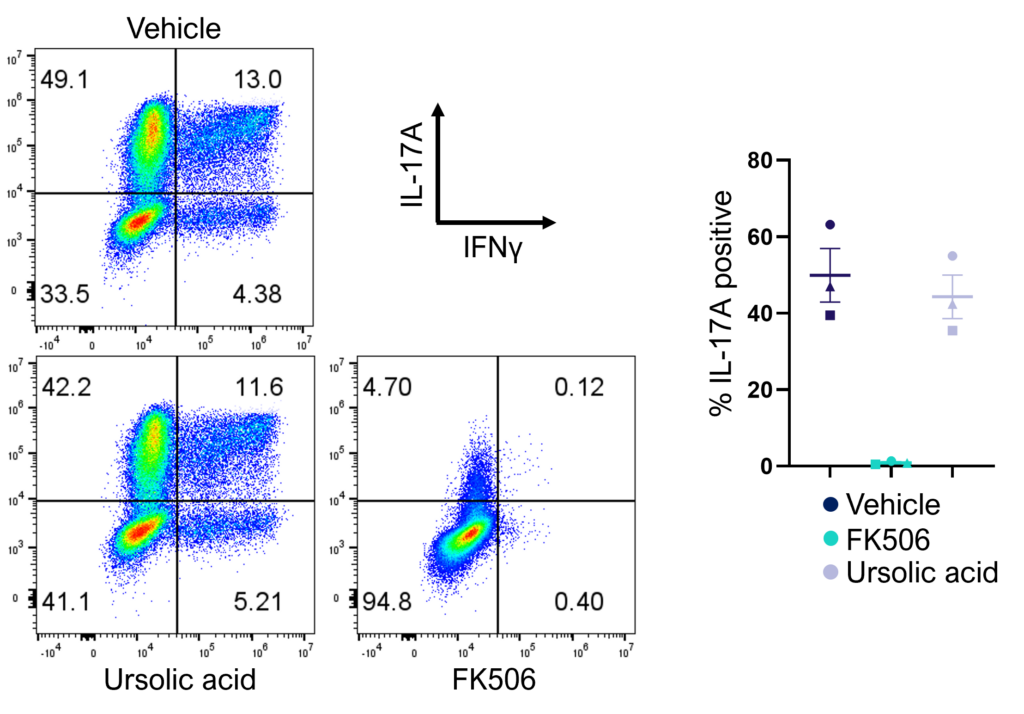
Figure 2: Inhibition of Th17 cell effector function. Magnetically sorted memory Th17 cells were polyclonally stimulated under Th17 conditions in the presence or absence of ursolic acid or FK506 for 5 days. A percentage of Th17 cells are polyfunctional (IL- 17A+IFNγ+) and refractory to inhibition by ursolic acid (an inhibitor of Th17 differentiation) but not FK506.
For many the humble “workhorse” mixed lymphocyte reaction (MLR) is a key screening assay for immuno-therapeutics. 1-way (DC and T cells) and 2-way MLRs (PBMC) provide expression of key ligands on human immune cells for therapeutic modulation.
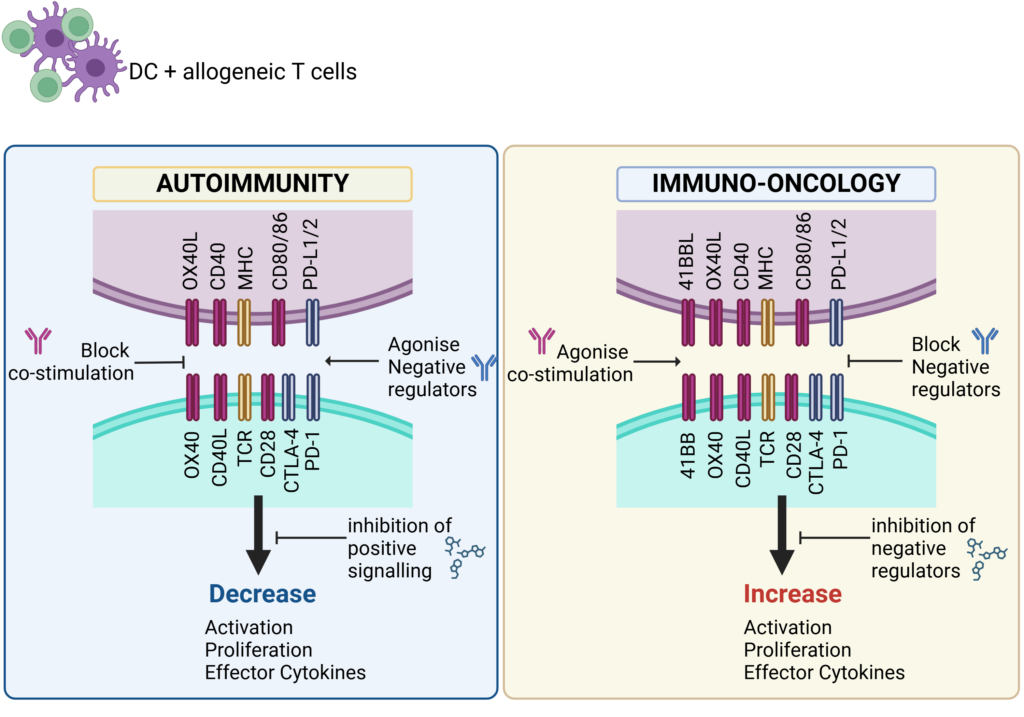
Schematic showing key therapeutic targets that are blocked (antagonise) or engaged (agonise) to control immune responses in Autoimmunity or boost immune responses for Immuno-Oncology.
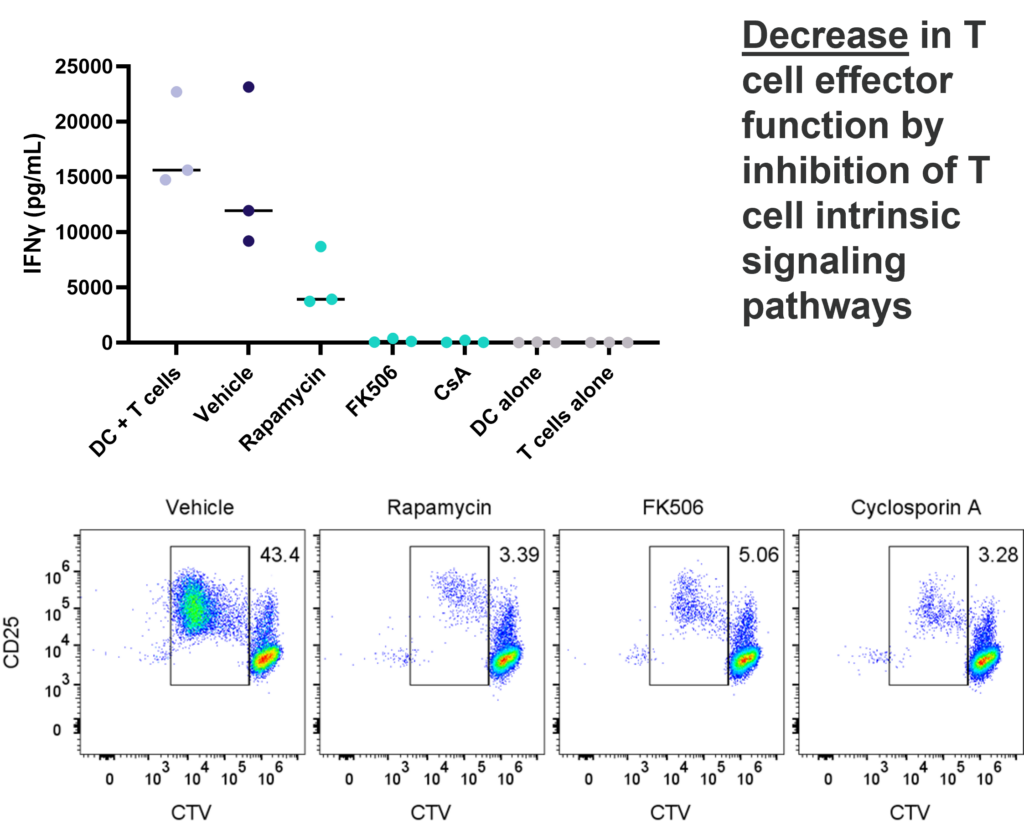
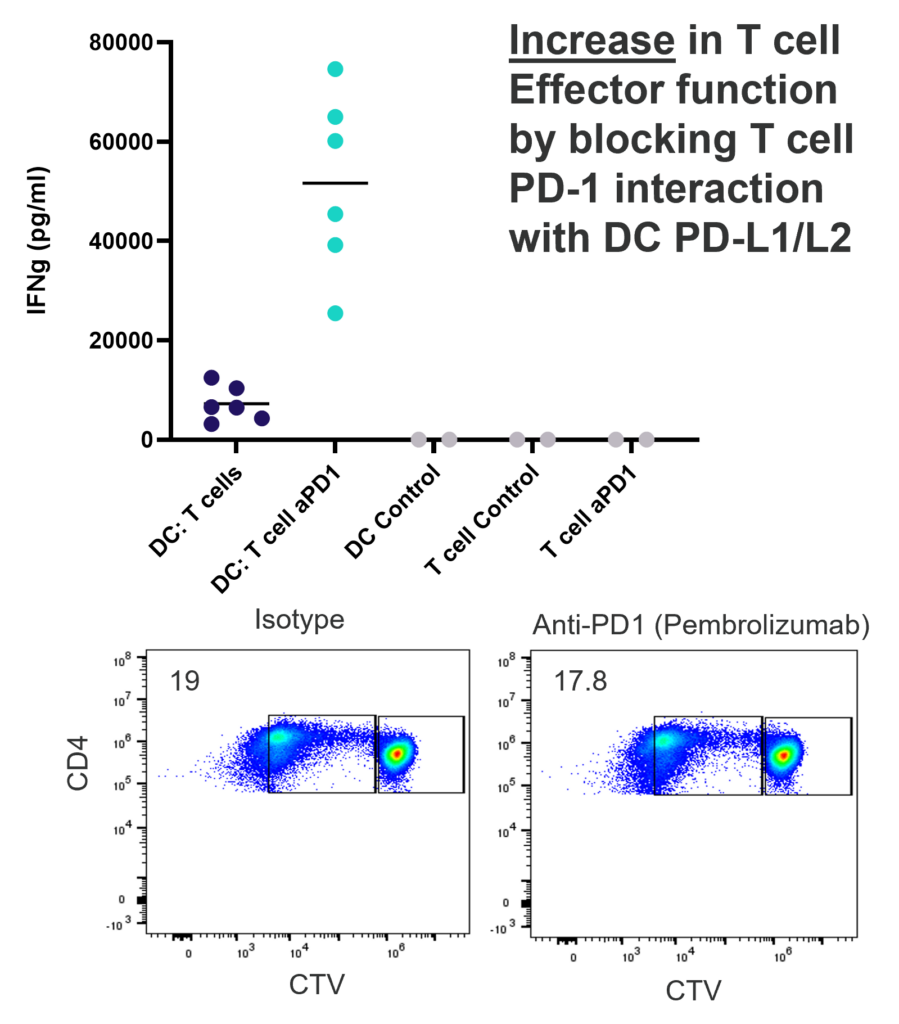
1-way or 2-way MLR. One way MLR of CTV labelled T cells in response to allogenic DC, matured with LPS. T cell proliferation and IFNγ production is inhibited by Rapamycin, FK506 and Cyclosporin A, in contrast, PD-1 blockade (Pembrolizumab) increases T cell IFNγ production, but does not enhance T cell proliferation.
This assay provides a relevant human system to test novel therapeutics that block or engage key co-stimulatory or inhibitory ligands expressed on immune cells.
Natural Tregs (nTregs) are a thymus-derived subset of CD4+ T cells found in peripheral blood, capable of suppressing immune responses to maintain tolerance and homeostasis. Suppression assays model Treg function by measuring their ability to inhibit effector T cell proliferation, activation, and cytokine production. Altering Treg suppressive function can have promising therapeutic potential, both in the context of autoimmunity and immuno-oncology.
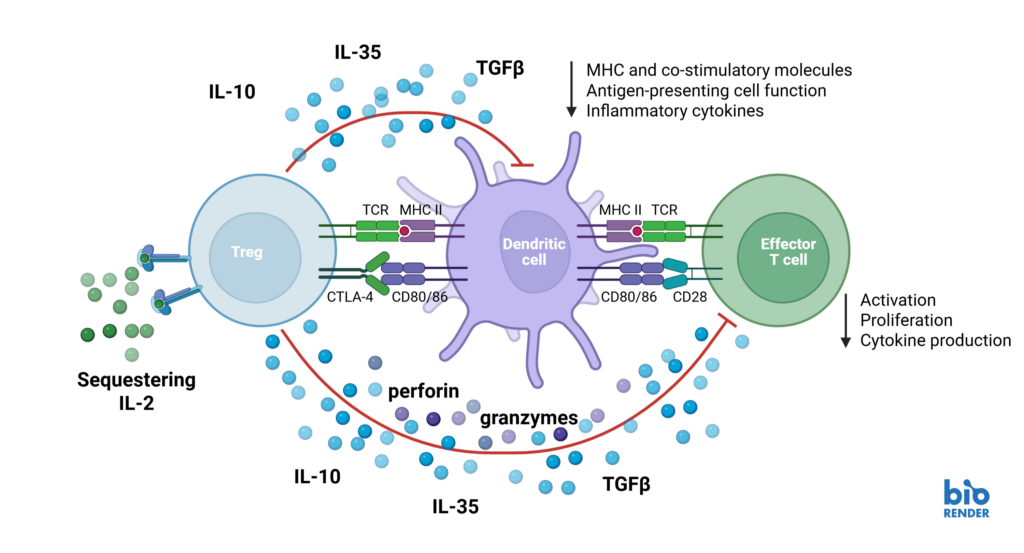
Schematic showing mechanisms by which regulatory T cells suppress effector T cell responses.
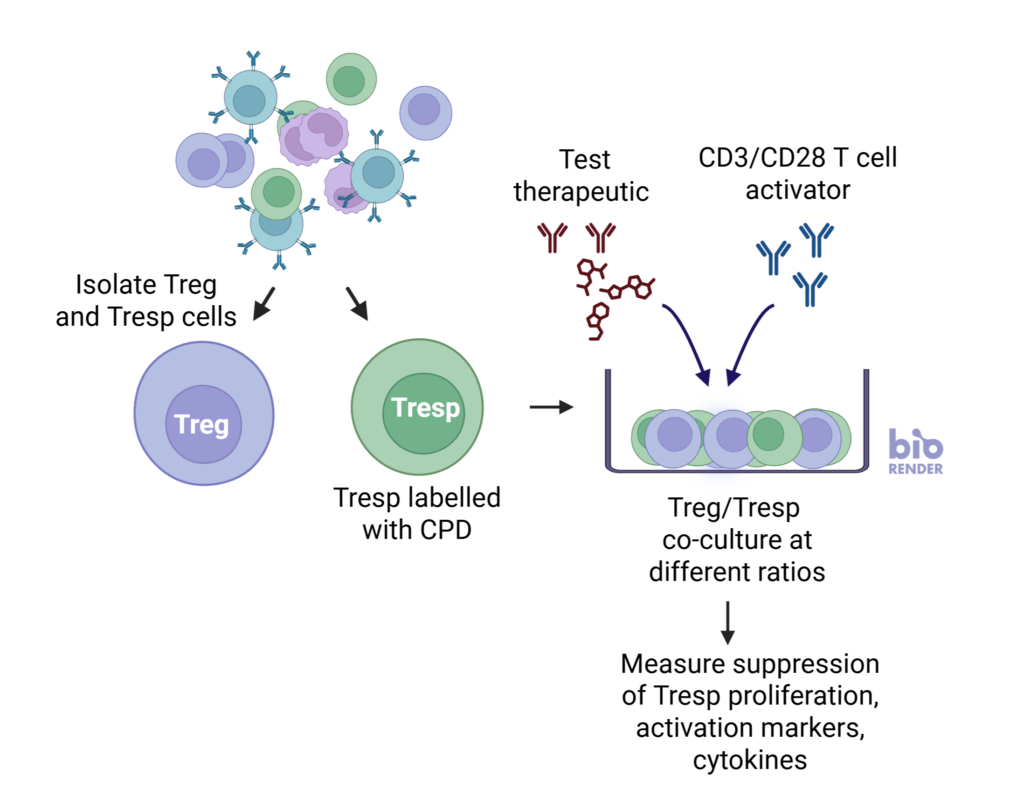
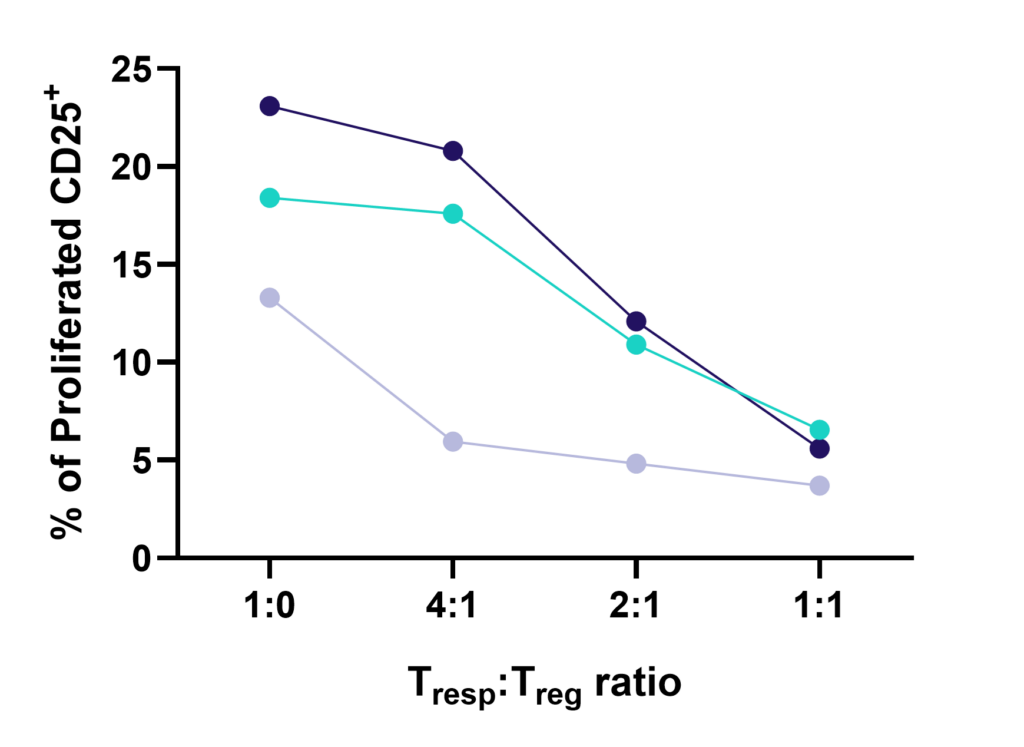
nTreg cells suppress the proliferation of Tresp cells in a ratio-dependent manner
nTregs were co-cultured with stimulated CD3 T cells at three Tresp:Treg ratios. Graphs show increased suppression of Tresponder proliferation in the presence of increasing number of Tregs. Data shown from three healthy donors.
I. T cell response to Tetanus Toxoid, Influenza and PPD antigens
II. Dose response to Influenza antigen
Antigen specific T cells response to a recall antigens. (I) Healthy donors PBMC were stimulated with PHA-M or triple antigen cocktail (Tetanus Toxoid, Influenza and PPD). Cyclosporin was used as a reference treatment. (II) Dose response to Influenza antigen. CD4 and CD8 T cells proliferation was measured by flow cytometry using CTV dilutions.

Cellular Therapy
Immune-Oncology Assays
- CAR-T (on/off target assay, cellular persistence, exhaustion, immunogenicity, tumorgenicity)
- NK-CAR
- TCR based therapeutic
- γδ T cell therapeutics (NKG2D/γδ TcR) killing
Autoimmunity Assays
- Treg (on target assay, cellular persistence, exhaustion, immunogenicity, tumorgenicity)
Innate Lymphoid Cell
Autoimmunity Assays
- ILC1/2/3 phenotype
- Cytokine production
Inflammation Assays
- ILC1/2/3 phenotype a
- Cytokine production