CD8+ T cell
Immune-Oncology Assays
- 2D/ 3D Tumour Killing Assay (panel of tumour cells available)
- Check point modulation (PD-1, CTLA-4)
- Antigen-specific CTL-CEFT (phenotype, proliferation, degranulation)
- MART-1 specific CTL- cytotoxicity
- T cell exhaustion
Autoimmunity Assays
- Activation
- Proliferation and function
- Naive and Memory responses
Assays
3D immune mediated Tumour Killing Models: Tools for screening immune or tumour targeted therapeutics
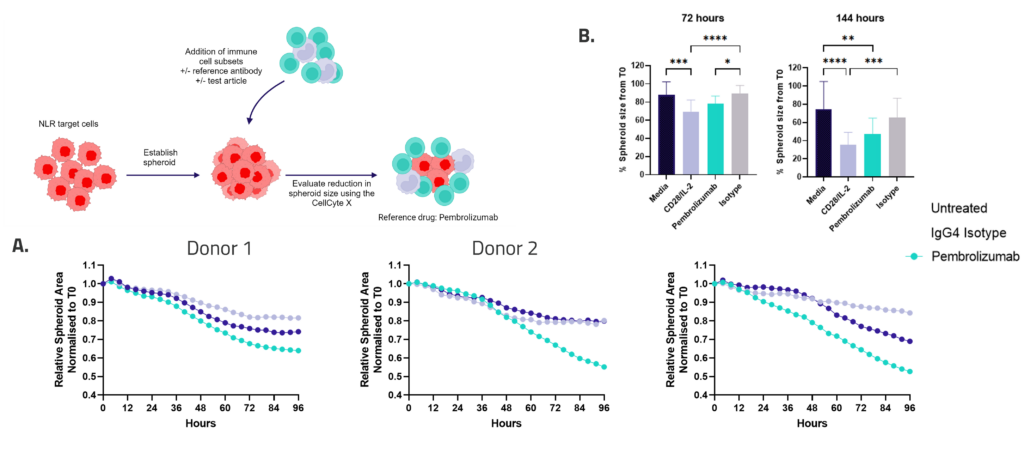
Figure 1: SKOV-3 NLR tumour cells were seeded into 96 well plates, PBMC were added once spheroids were established in the presence of Pembrolizumab or IgG4 control or vehicle (untreated) and imaged every 4 hours for 96 hours using the CellCyte X. Relative spheroid area (%) was measured (A). AUC statistics were calculated using GraphPad Prism v9.5.0
ELISpot is a highly sensitive method to test immune modulators, novel vaccine candidates or de-risk immunogenicity testing in an antigen-specific CD4 and/or CD8 T cell assay.
| Condition | Aim |
| No Stimulation | Negative control |
| PMA | Positive control |
| CERI (CMV, EBV, RSV, Influenza) | MHC-I restricted peptide pool to evaluate modulation of CD8+ T-cell memory response |
| CPI (CMV, Parainfluenza, Influenza) | Positive protein antigens to evaluate modulation of CD4+ T-cell memory response |
| CEF (CMV, EBV, Influenza) | MHC-I restricted peptide pool to evaluate modulation of CD8+ T-cell memory response |
| Cyclosporin A (CsA) | Inhibition of immune response |
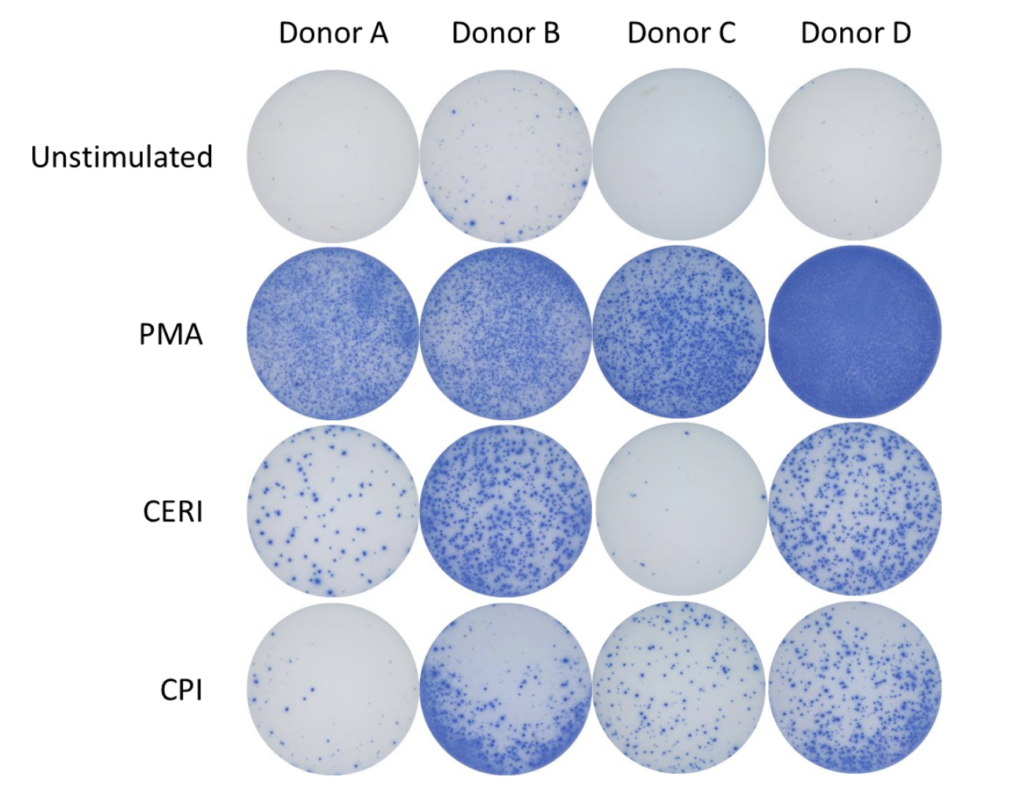
Figure 1: The ELISpot visual image results showing four donors under four conditions: Unstimulated (negative control), stimulated with PMA (positive control), stimulated with CERI, and stimulated with CPI antigens. Each purple spot represents one IFNγ producing cell.
Spot Forming Units (SPU) for IFN-γ per 100,000 PBMC from CERI, CPI and CEF antigens for three donors
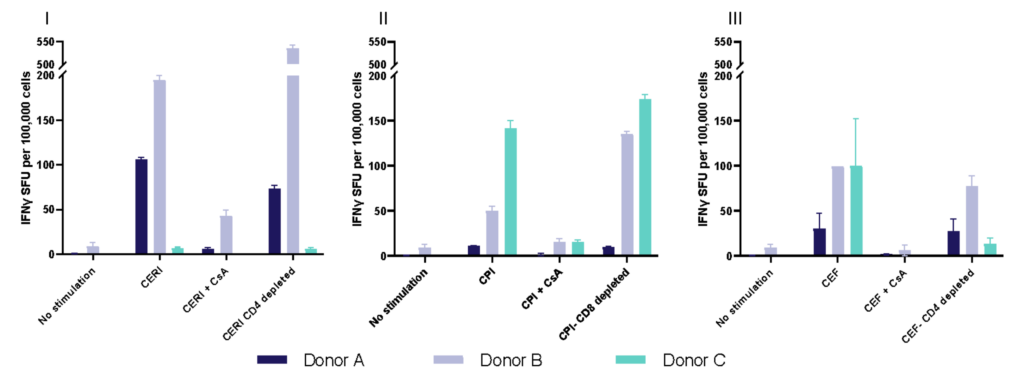
Figure 2: T cell responses from three donors using stimuli, CERI (I), CPI (II) and CEF (III). Expressed as spot forming units per 100,000 donor PBMC. Depletion of CD4 or CD8 T cells demonstrates specificity of response to peptide pools. Each value represents the mean of triplicate wells ±SEM.
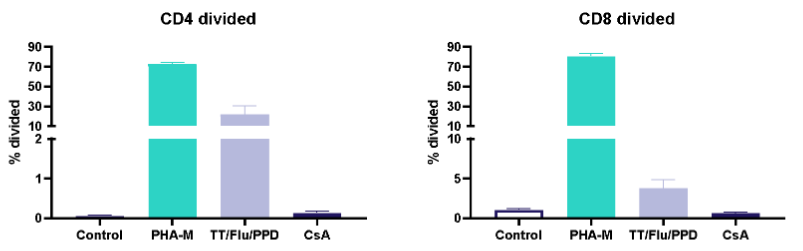
I. T cell response to Tetanus Toxoid, Influenza and PPD antigens
II. Dose response to Influenza antigen
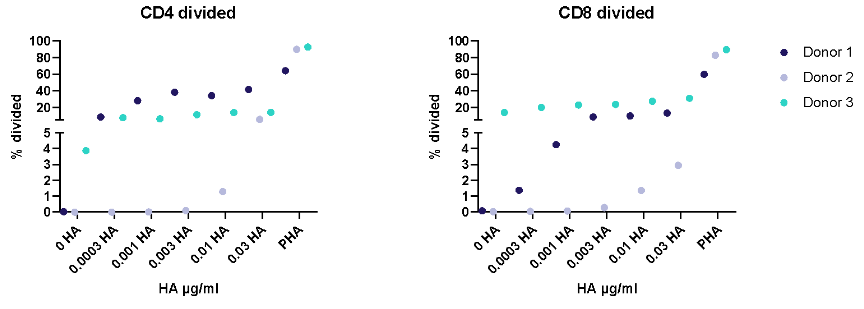
Antigen specific T cells response to a recall antigens. (I) Healthy donors PBMC were stimulated with PHA-M or triple antigen cocktail (Tetanus Toxoid, Influenza and PPD). Cyclosporin was used as a reference treatment. (II) Dose response to Influenza antigen. CD4 and CD8 T cells proliferation was measured by flow cytometry using CTV dilutions.

Drug Discovery Tool
Find the right immune assay for your therapeutic area, modality and target using this interactive Drug Discovery Tool.